| | Demography
(population by community • place of residence • age group • families • testimonials) Demography - population by community | |
| | | | | | | | The Cree population has grown rapidly over the last 30 years, almost tripling (+ 189%) between 1971 and 2003. This trend began in the early 1950s with the institution of healthcare services and social assistance. The smallest population growth during this period was in Mistissini (+ 79%), which lost part of its population when the villages of Nemaska and OujéBougoumou were created. | | | | Cree Community Populations – 1971 and 2003 | | 1971a | 2003 | 1971‑2003
variation
(%) | Community | Population | Community | Population | Great Whale | 329 | Whapmagoostui | 762 | 132 | Fort George | 1,280 | Chisasibi | 3,486 | 172 | Paint Hills | 514 | Wemindji | 1,170 | 128 | Eastmain | 282 | Eastmain | 593 | 110 | Fort-Rupert | 755 | Waskaganish | 1,743 | 131 | Mistissini | 1,598 | Mistissini | 2,855 | 79 | Waswanipi | 0 | Waswanipi | 1,314 | N/Ab | — | — | Nemaska | 580 | N/A | — | — | Oujé-Bougoumou | 596 | N/A | — | — | JBNQA territory | 669 | N/A | Total – 1971 | 4,758 | Total – 2003 | 13,768 | 189 | a. The 1971 data includes Crees, Inuit and non-Natives, except in the case of Great Whale, where only Crees are included (329 Crees out of a total of 1,019 inhabitants). b. N/A: not applicable. | Source: Statistics Canada, 1971 census of Canada, except for the Great Whale data, which comes from SDBJ and SEBJ, 1974; Register of Cree beneficiaries of the JBNQA, 2003. | | | | | | | | | | Cree Community Populations – 1971 and 2003 | | | | | | | 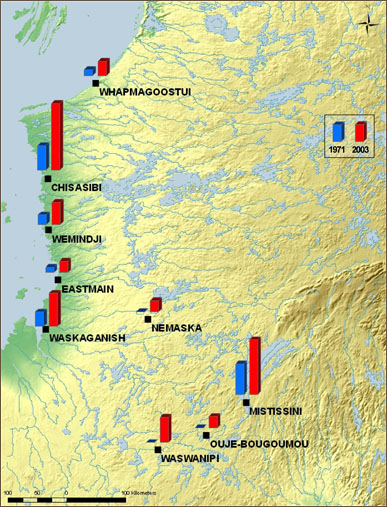 | | | |