Understanding meter displays
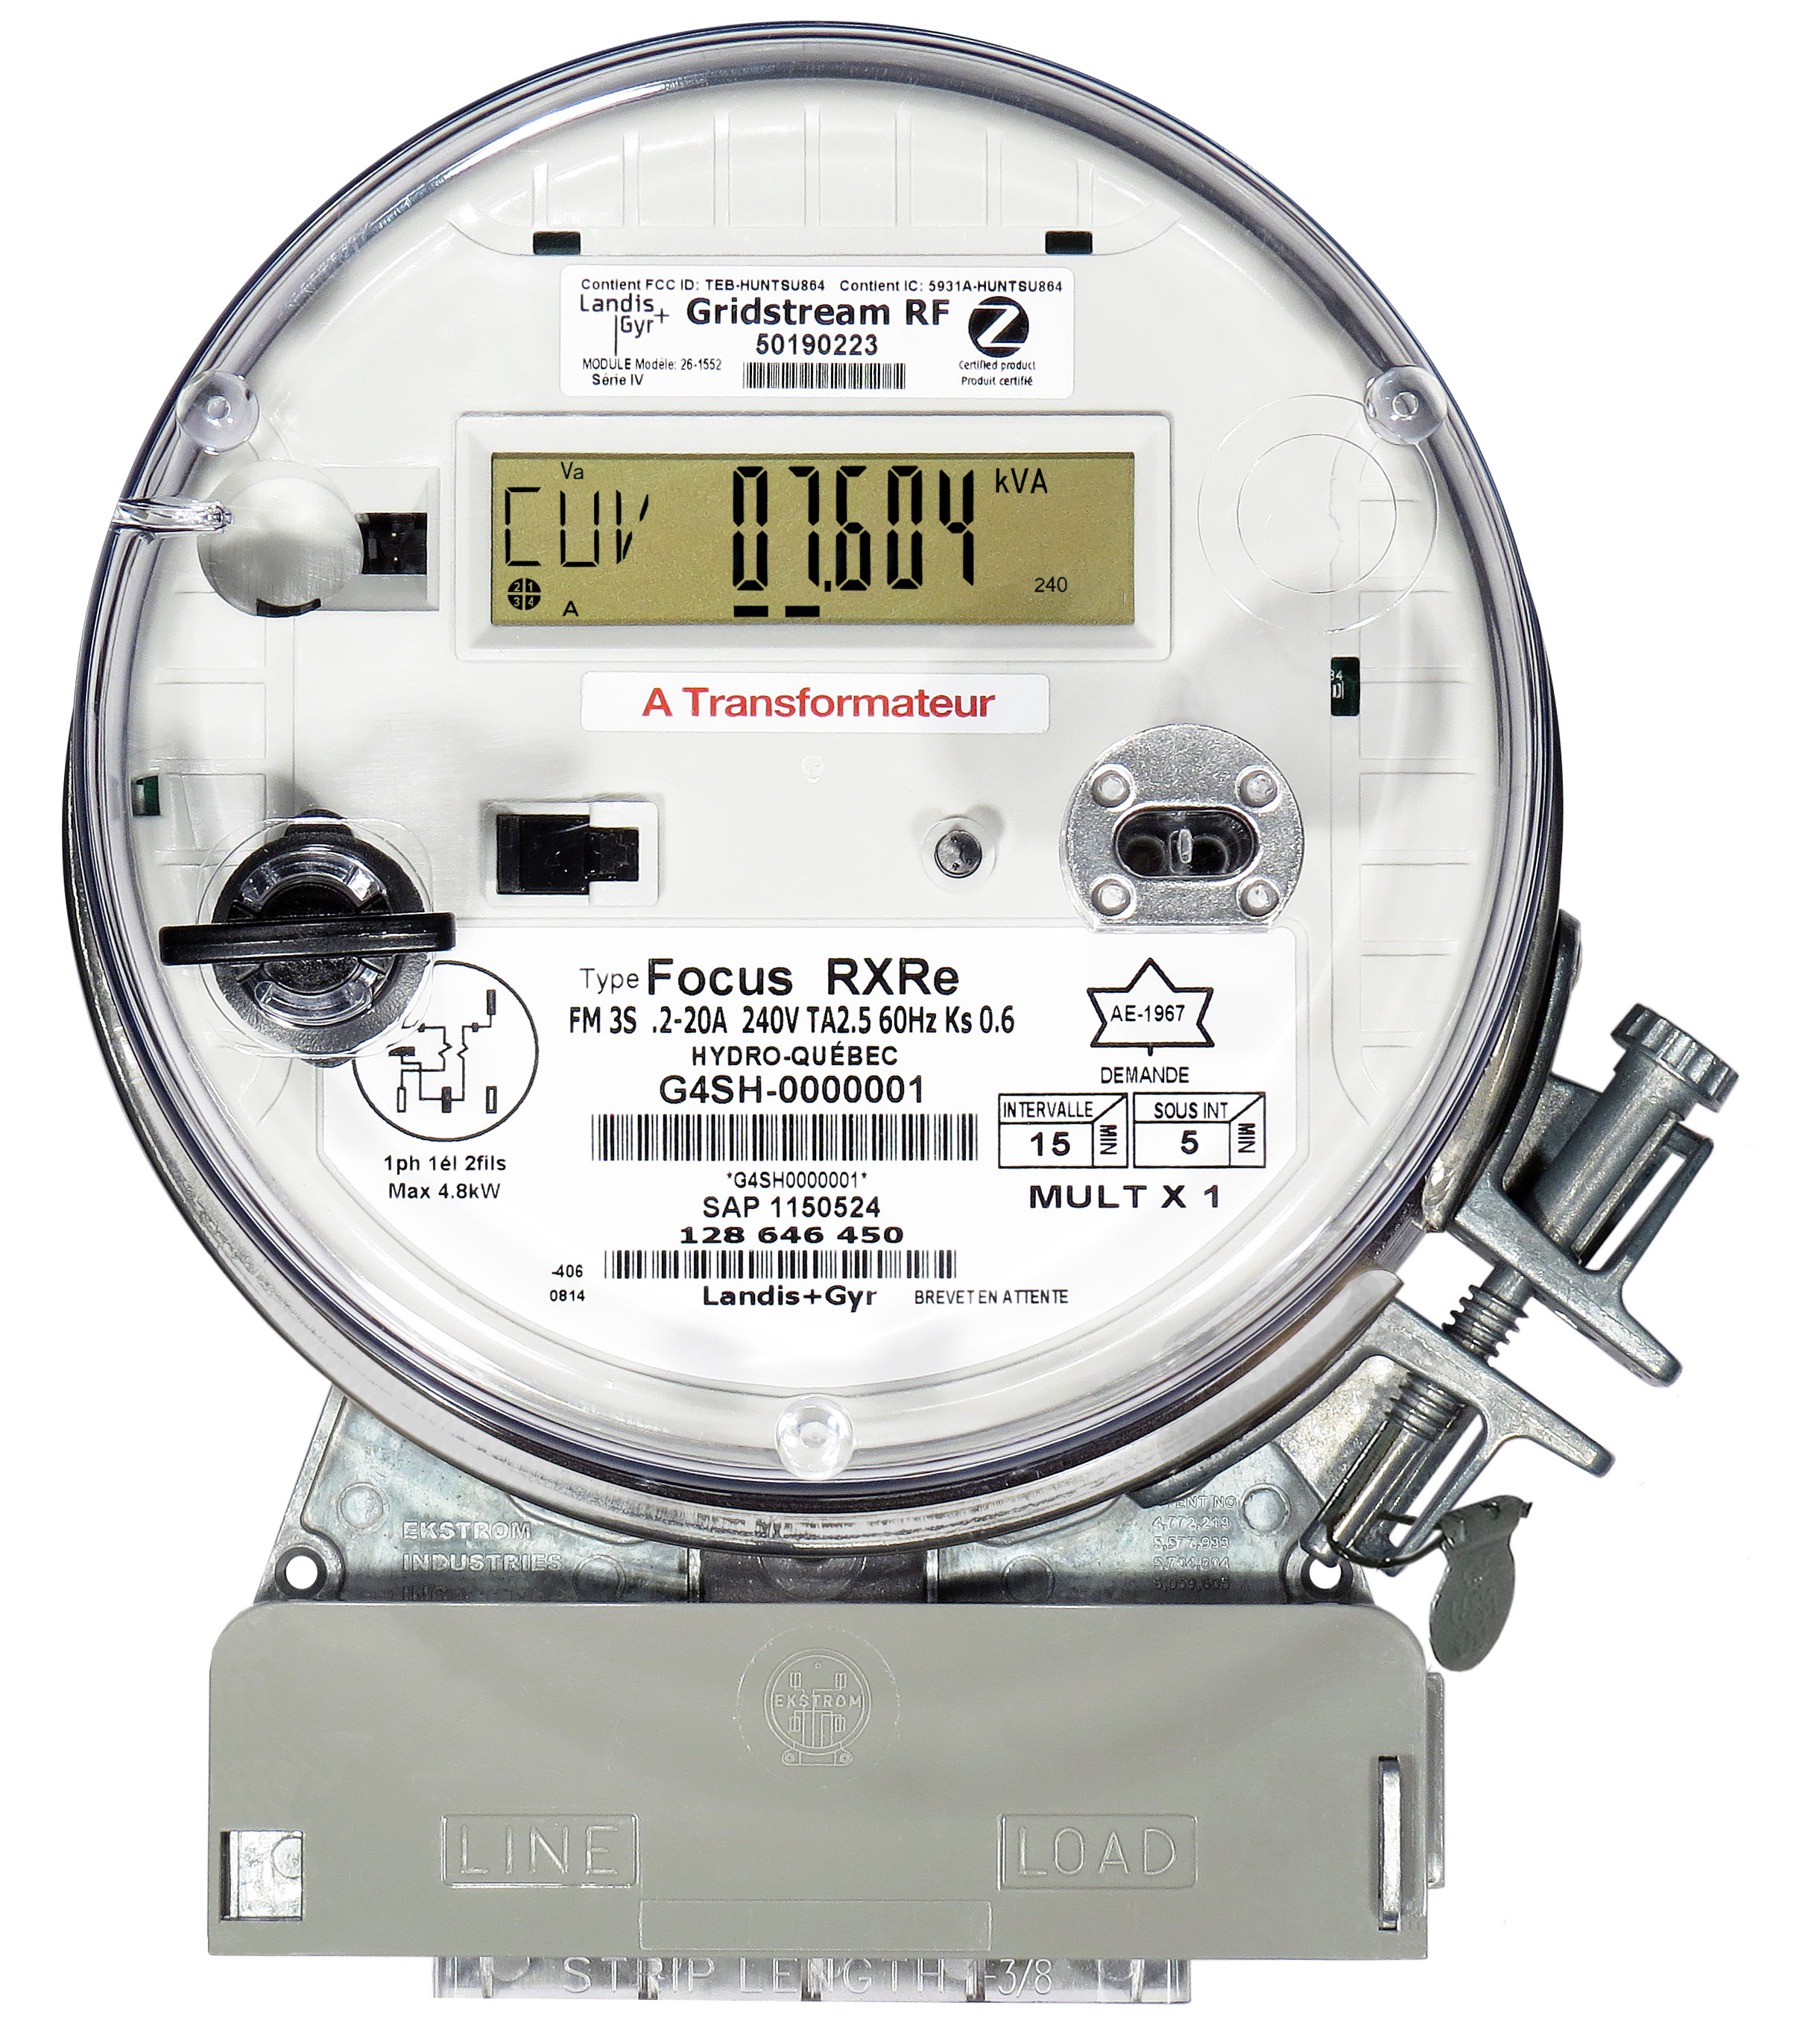
The information displayed on the digital screen of a communicating or non-communicating meter will differ according to the manufacturer. To understand these figures, you first need to identify the model of the meter Hydro‑Québec has installed.
Determining the model

-
Find the manufacturer’s name
In most cases, the name of the manufacturer can be found above the screen. The meters are generally made by Landis+Gyr, Elster, General Electric (GE) and Itron.
-
Find the identification number
If the number starts with:
- G4, G7, G8 or G9, the meter is communicating.
- X, the meter is non-communicating.
- Any other alphanumeric characters, it’s an old-generation meter. Hydro‑Québec will contact you when it’s time to install a communicating meter.
-
Determine the meter model
Using the first alphanumeric characters of the identification number, identify the model from the list below.
Identify the meter model
Unable to locate the manufacturer or series of characters corresponding to the meter identification number?
Communicating meters
Below are the main displays and information that appear at regular intervals on the screen.
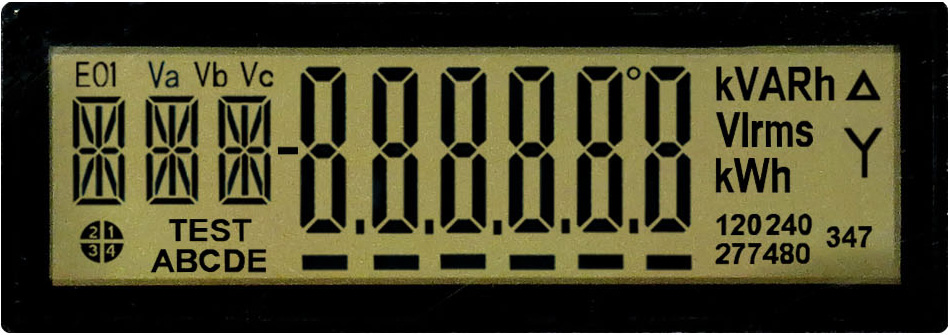
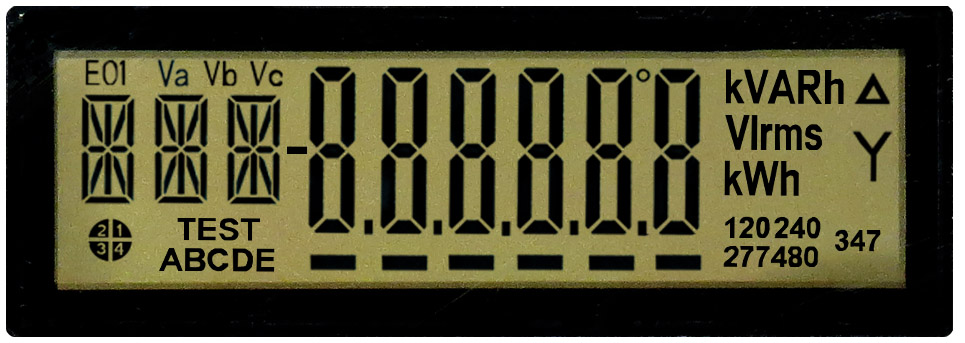
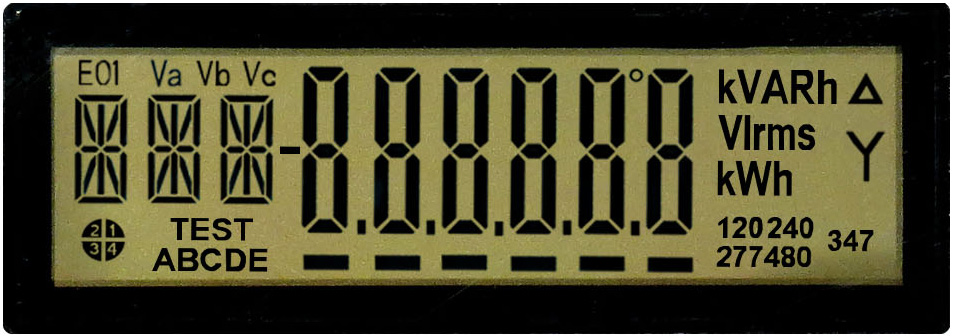
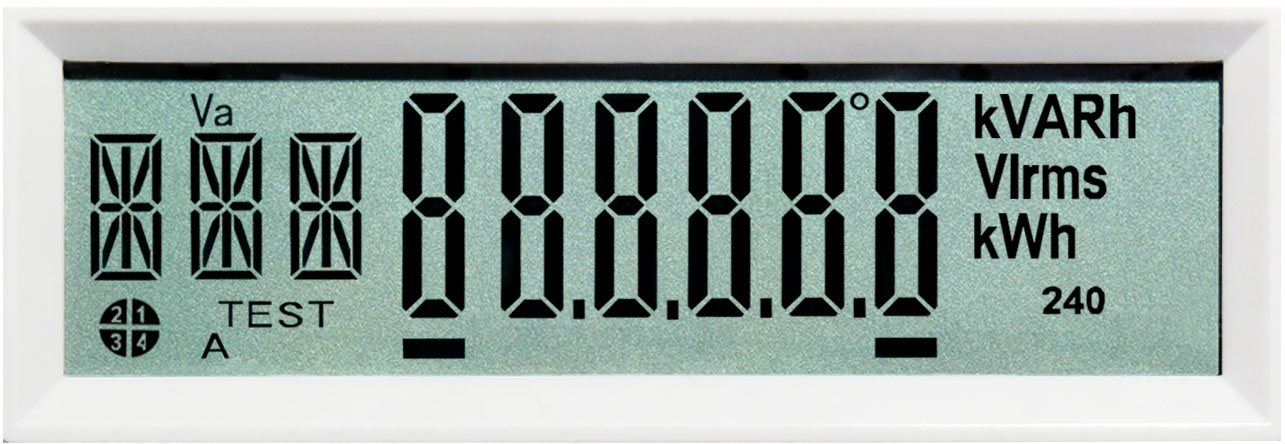
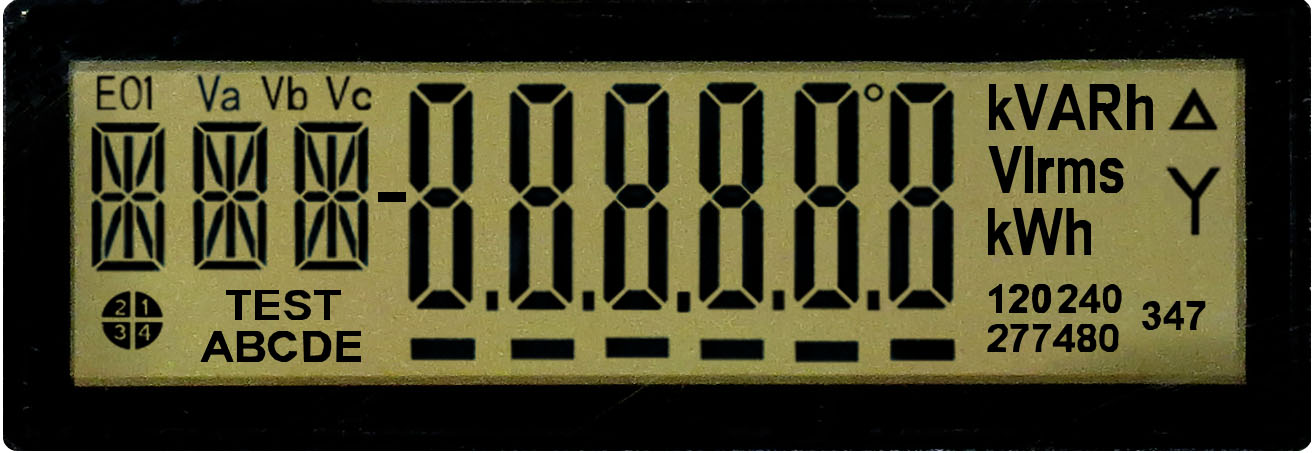
Display test
This screen shows that the liquid crystal display is working properly. When the 8s are displayed properly, the LCD is working.
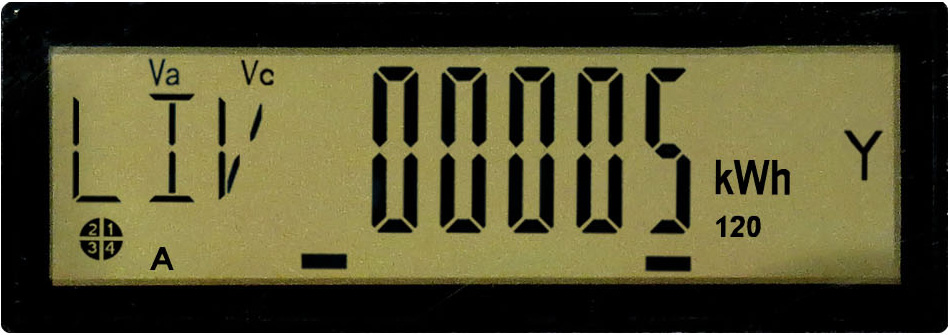
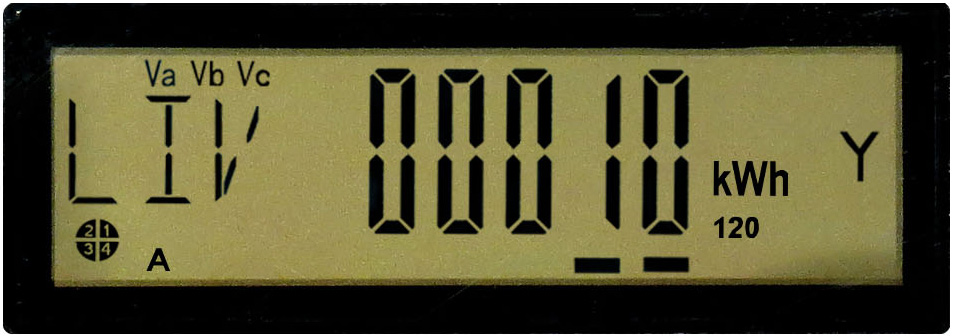
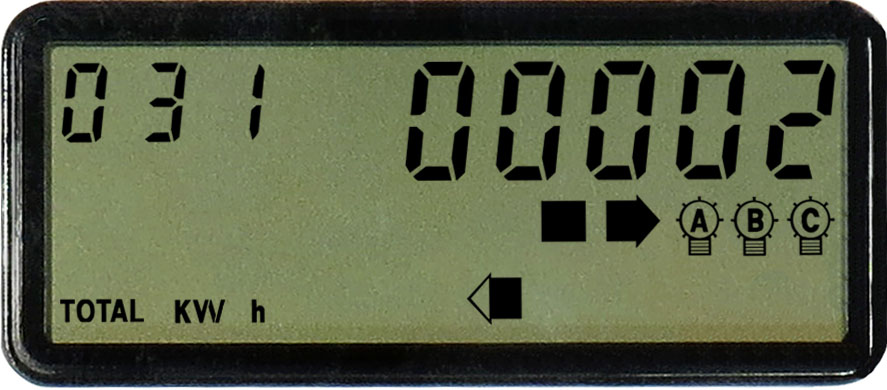
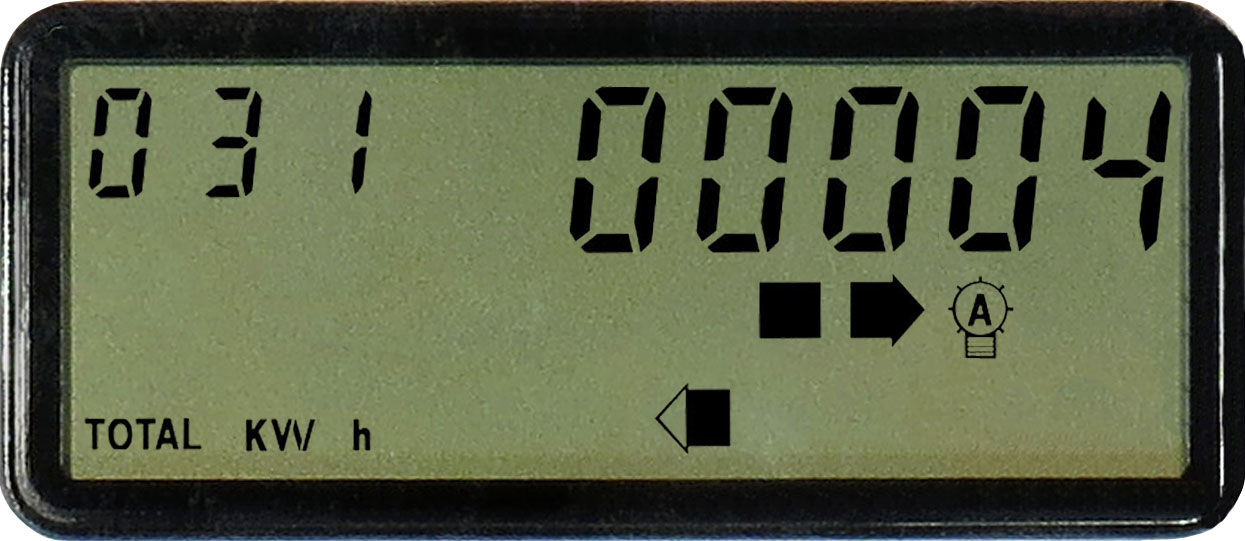
Energy consumed
This screen displays the letters LIV for énergie livrée (energy delivered), indicating the total number of kilowatthours (kWh) measured by the meter. The meter displays kWh as a running total, much like how a car odometer displays a running total of the distance travelled. In the image, you can see the total amount of energy consumed is 5 kWh.
When the meter is first installed, it may display a value other than 0. If this is the case, the installer will note the value and it will be subtracted from your next reading so that your bill reflects your actual consumption for the period in question.
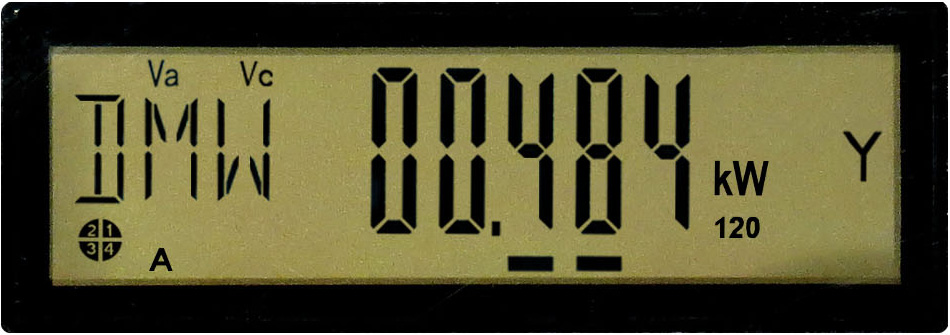
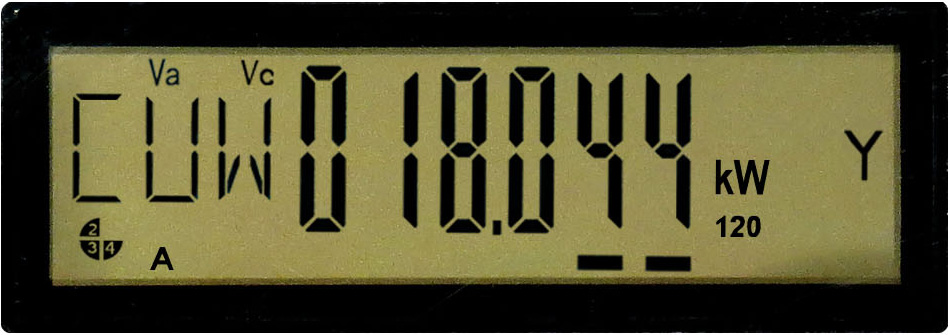
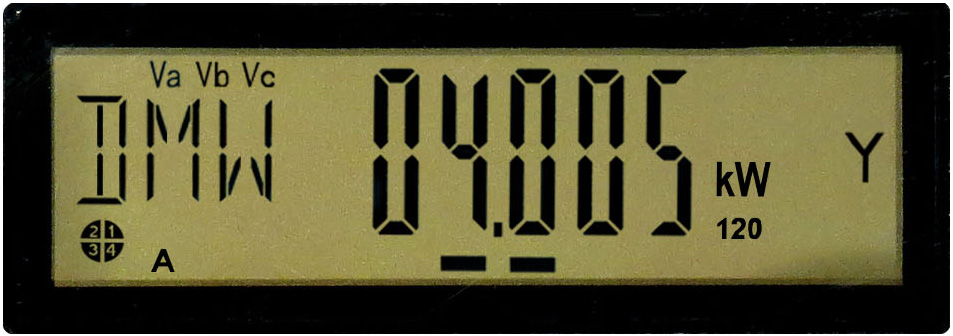
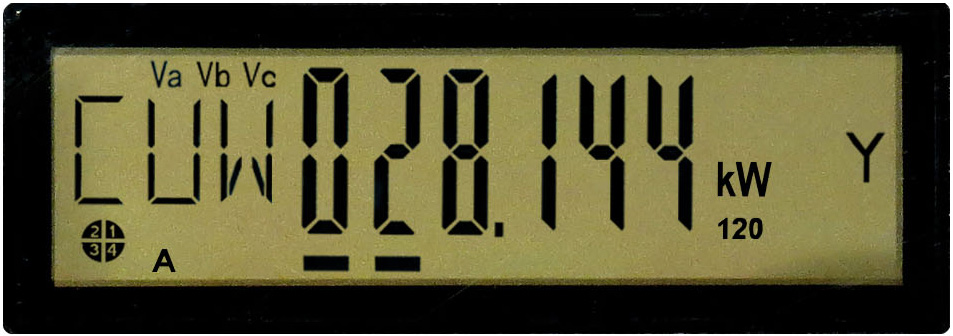
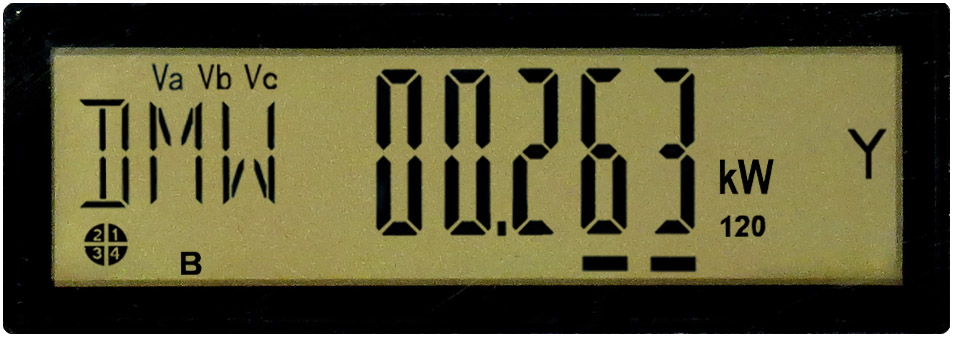
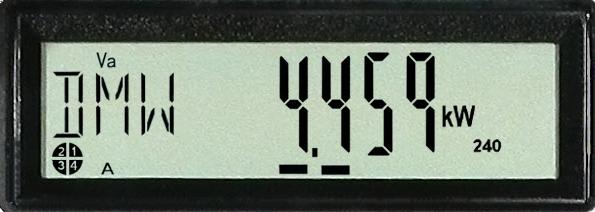
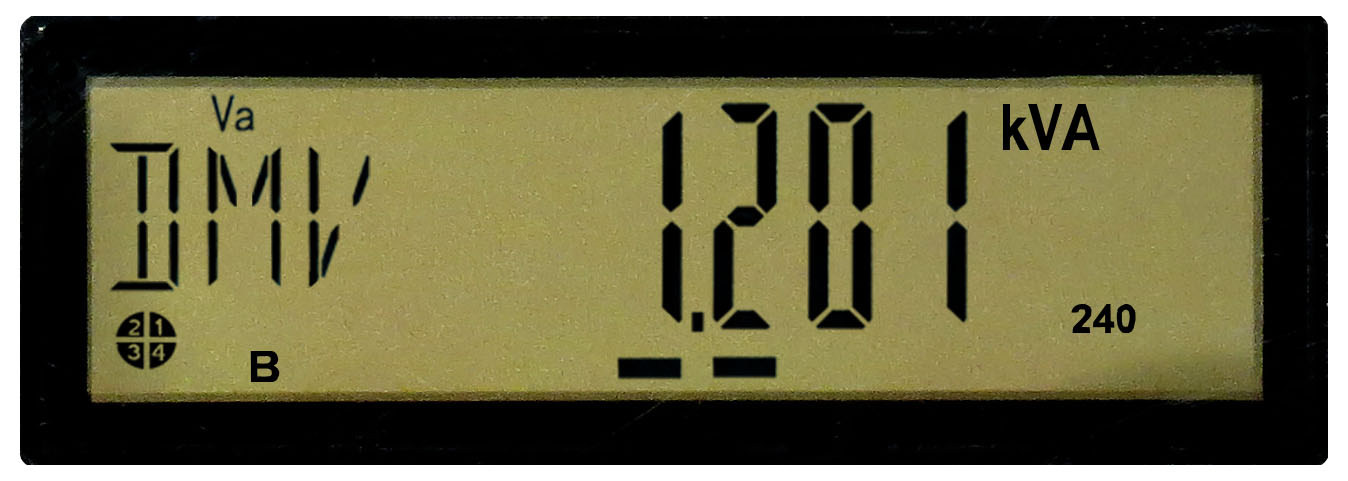
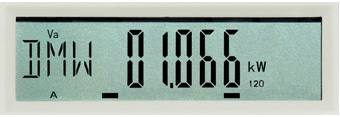
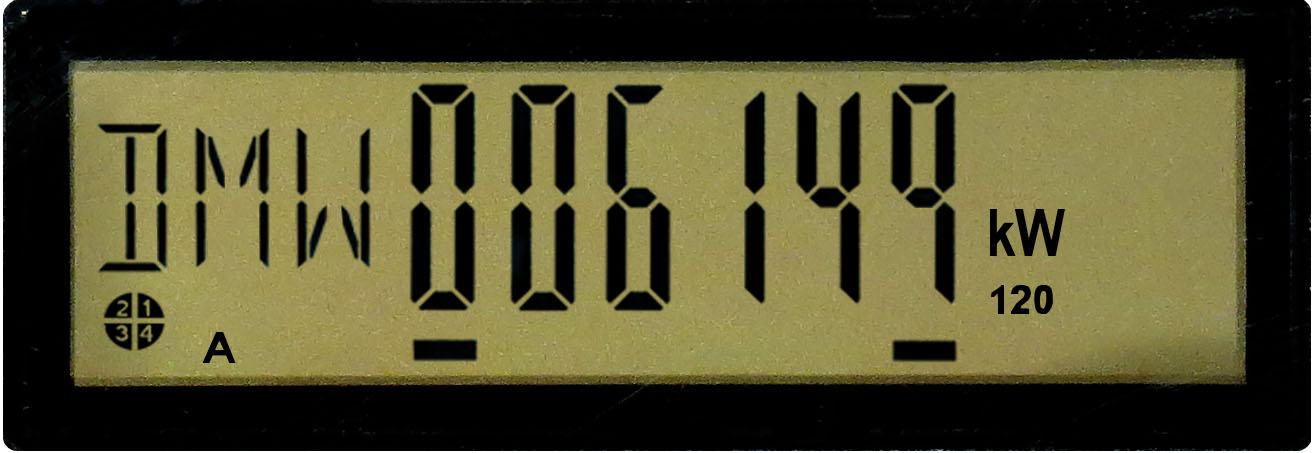
Real power
This screen displays the letters DMW for demande en watts (watt demand) and indicates the highest power demand (in kW) measured by the meter during a consumption period.
When the contract is for a rate with billed power demand, this value is reset to 0 at the start of each consumption period.
This data is used only for customers whose power demand is billed.
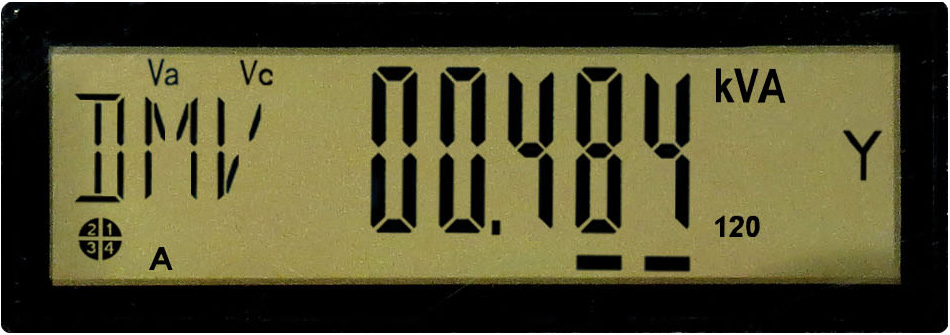
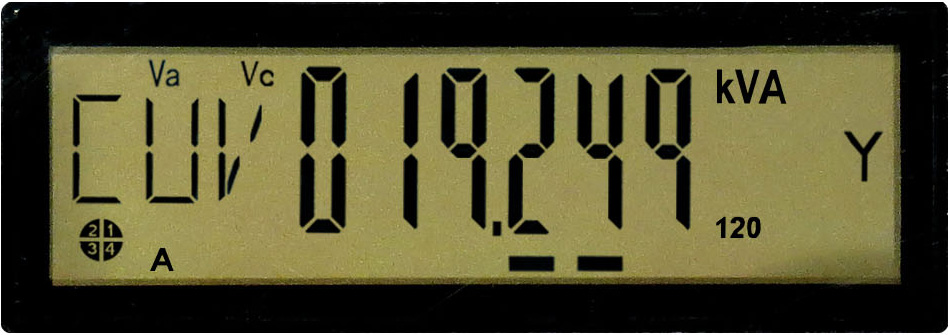
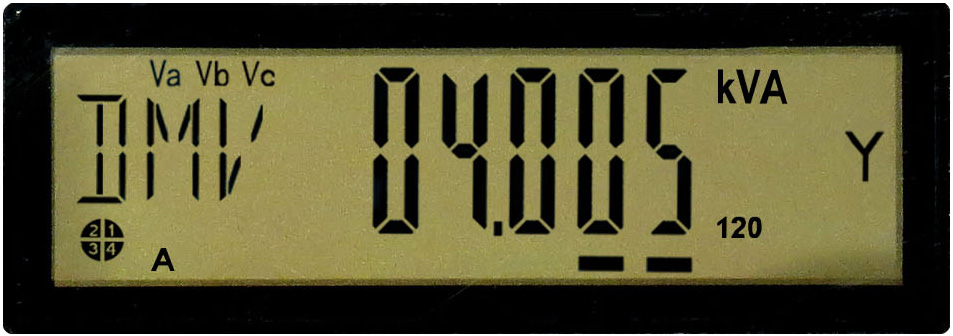
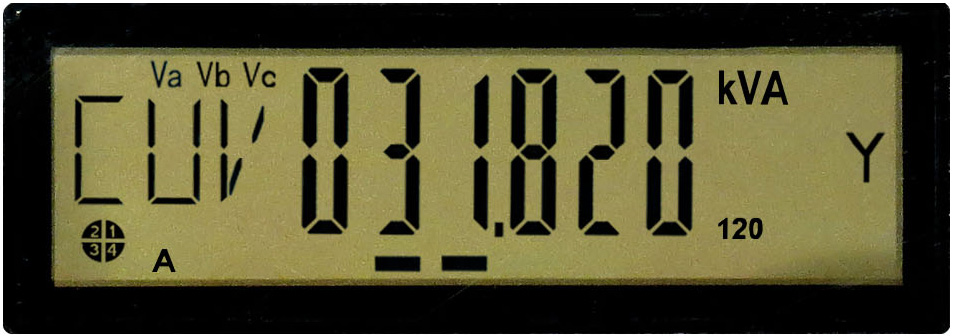
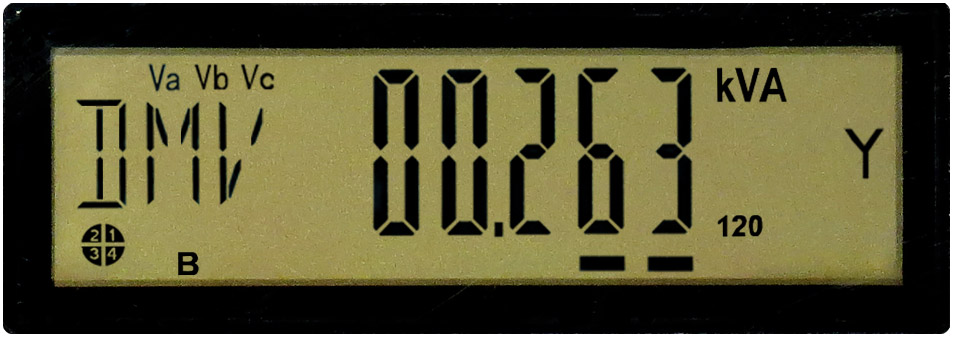
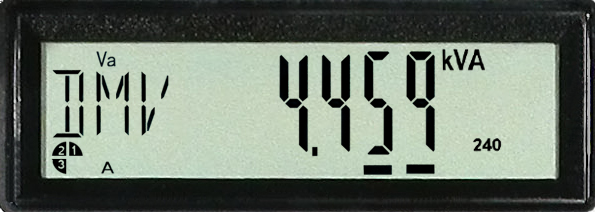
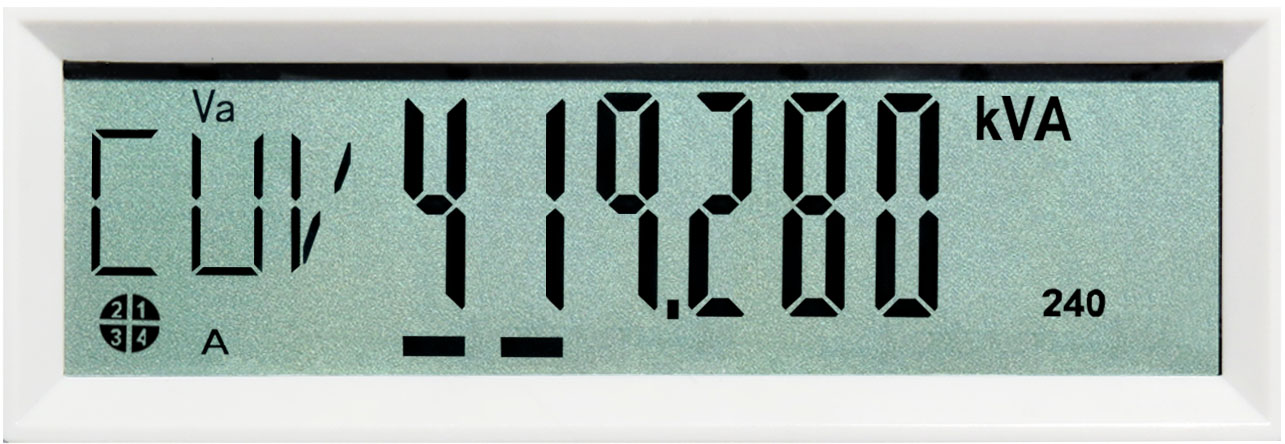
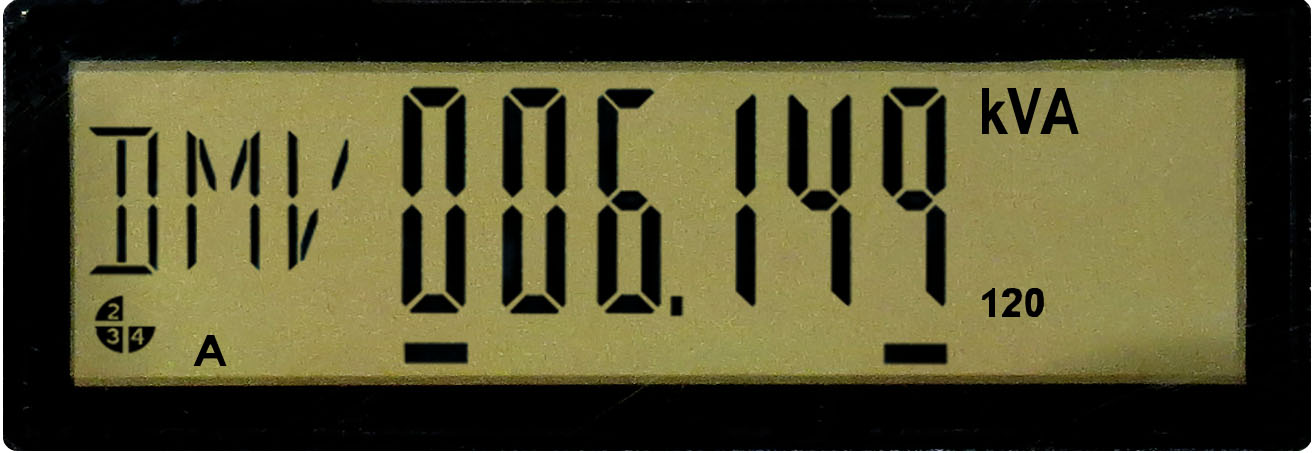
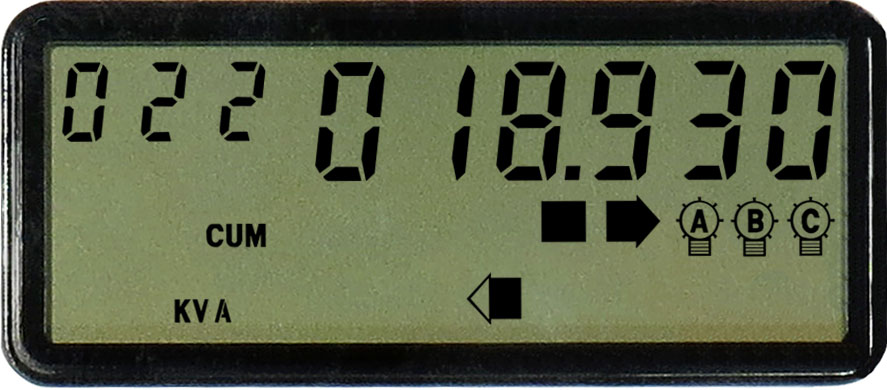
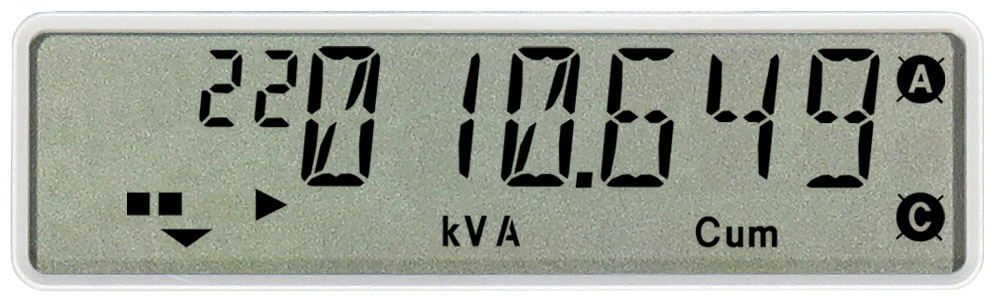
Apparent power
This screen indicates the highest power demand (in kVA) measured by the meter during a consumption period.
When the contract is for a rate with billed power demand, this value is reset to 0 at the start of each consumption period.
This data is used only for customers whose power demand is billed.
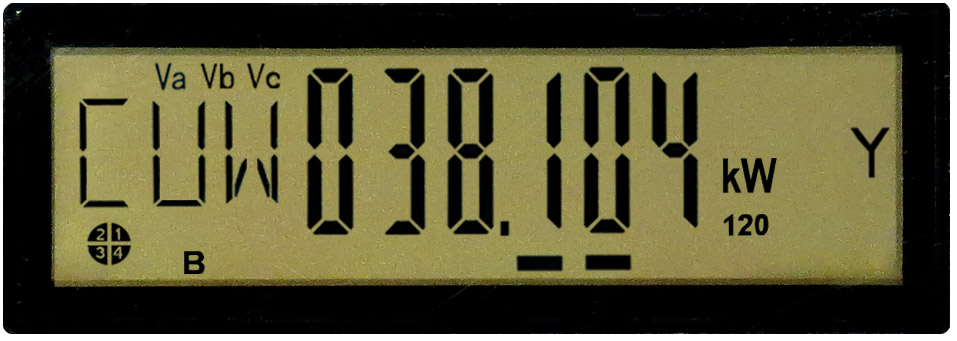
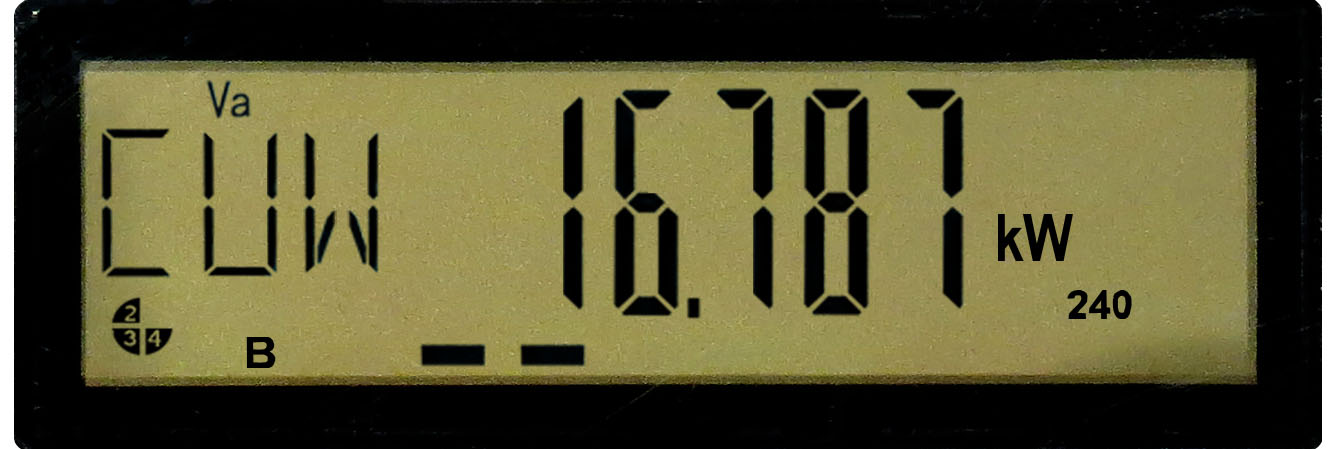
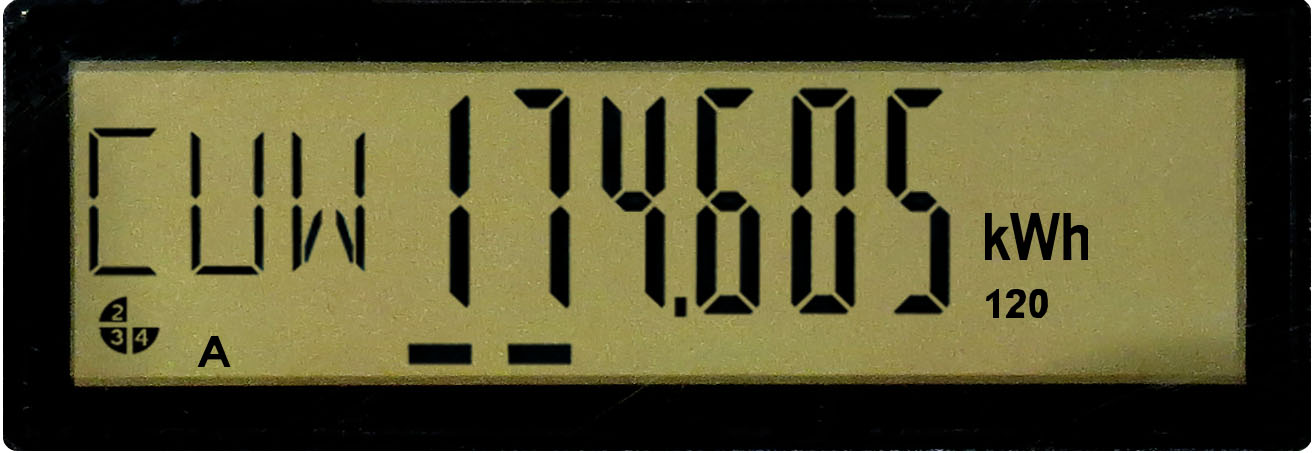
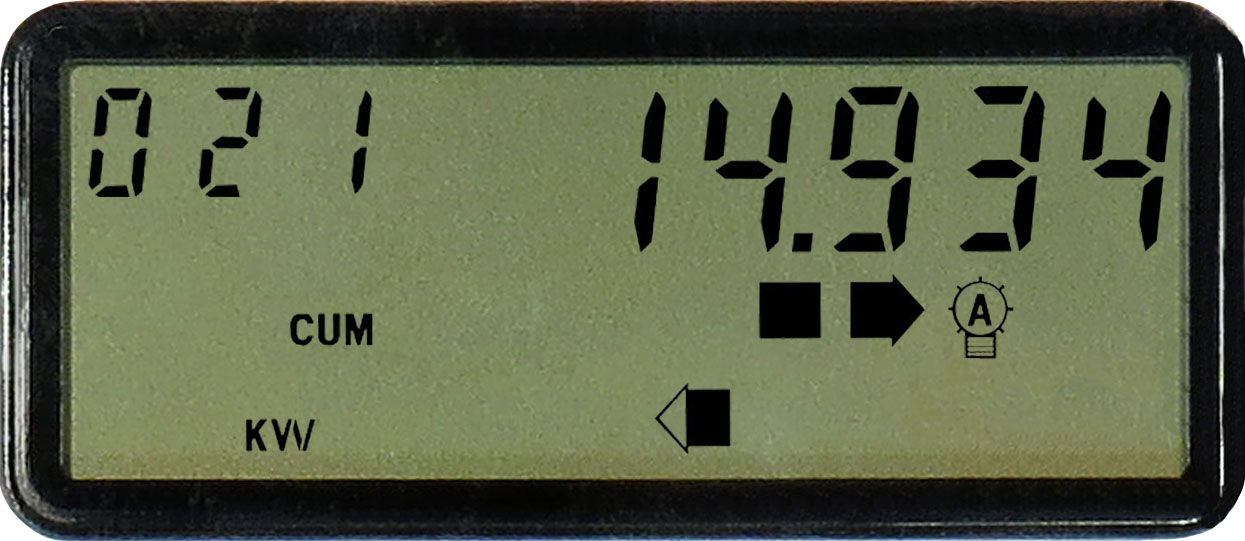
Cumulative real power
This display shows the cumulative real power for previous billing periods.
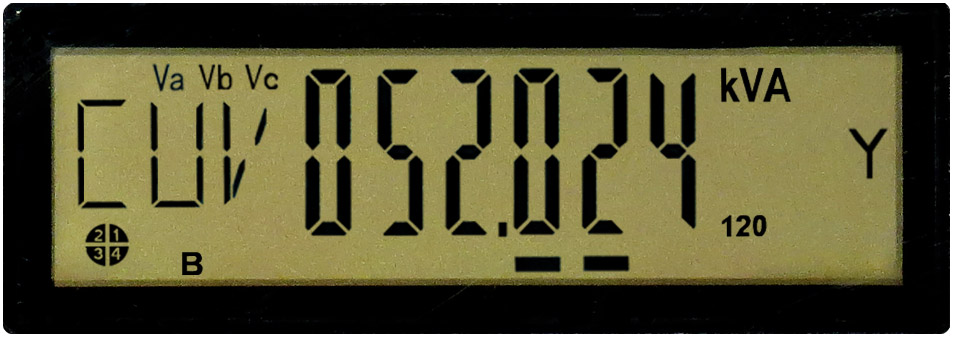
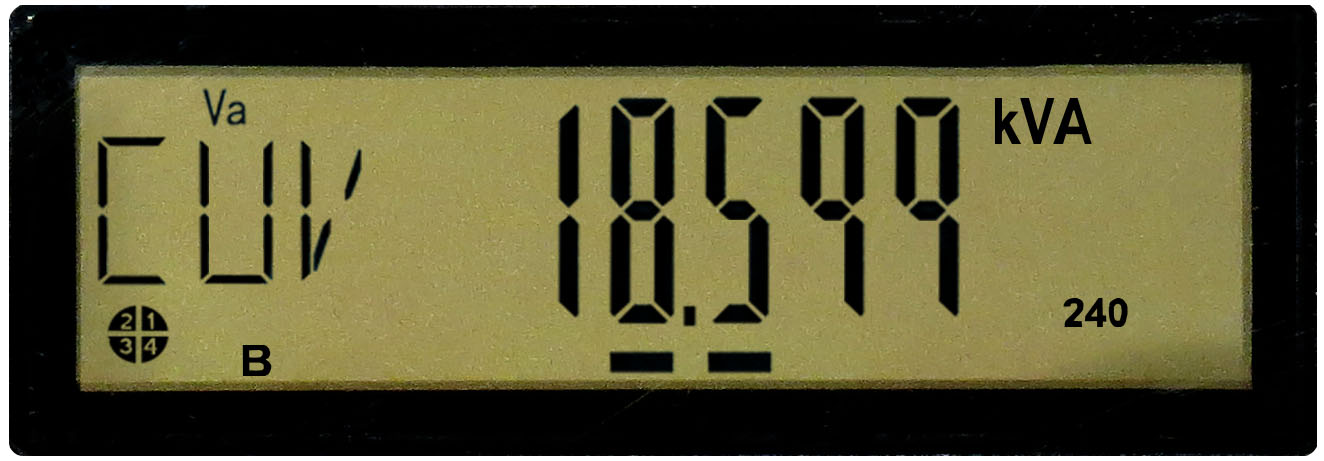
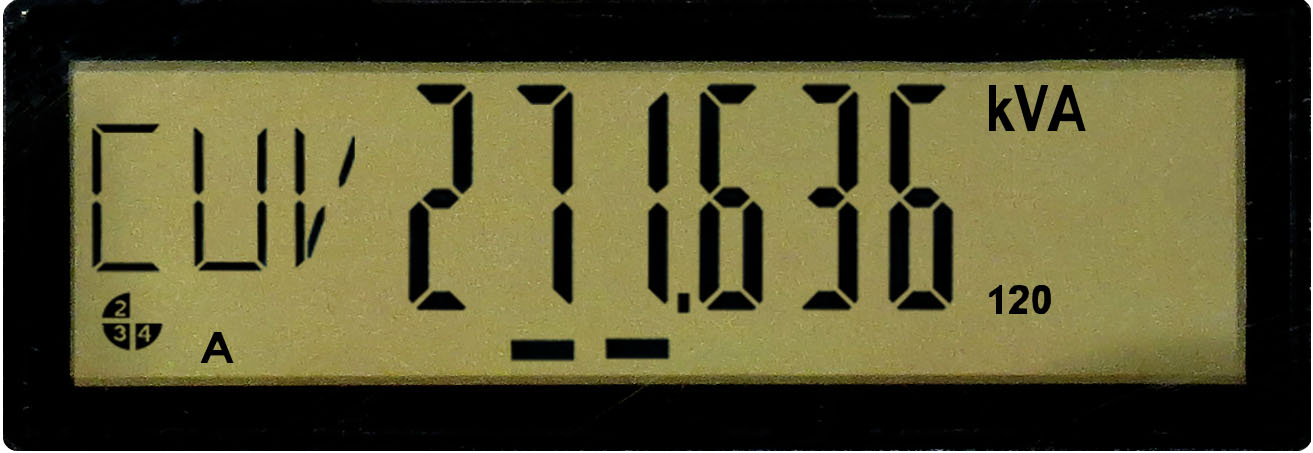
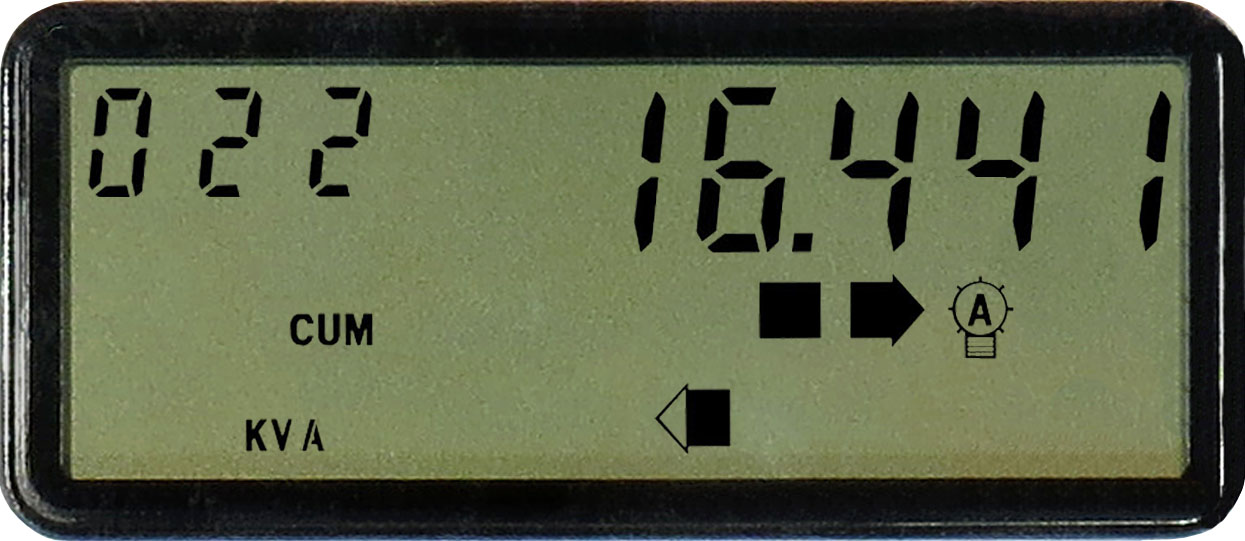
Cumulative apparent power
This display shows the cumulative apparent power for previous billing periods.
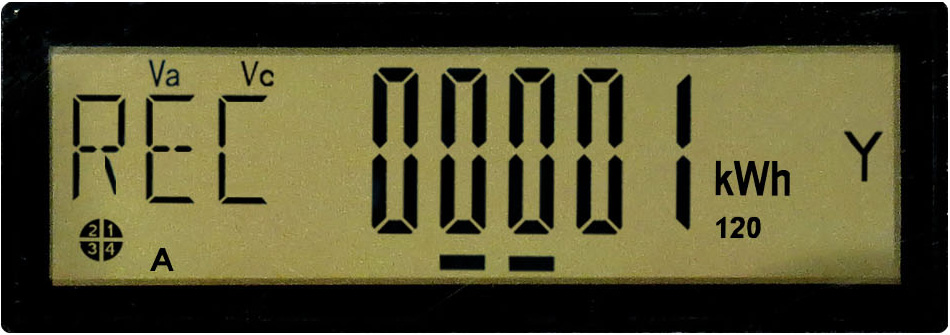
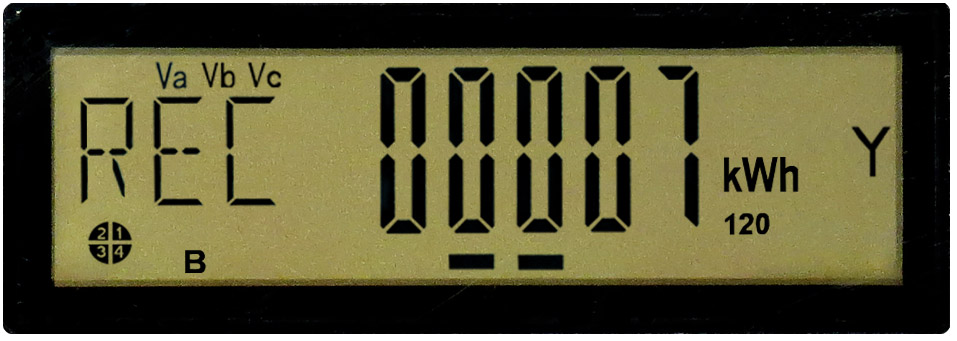
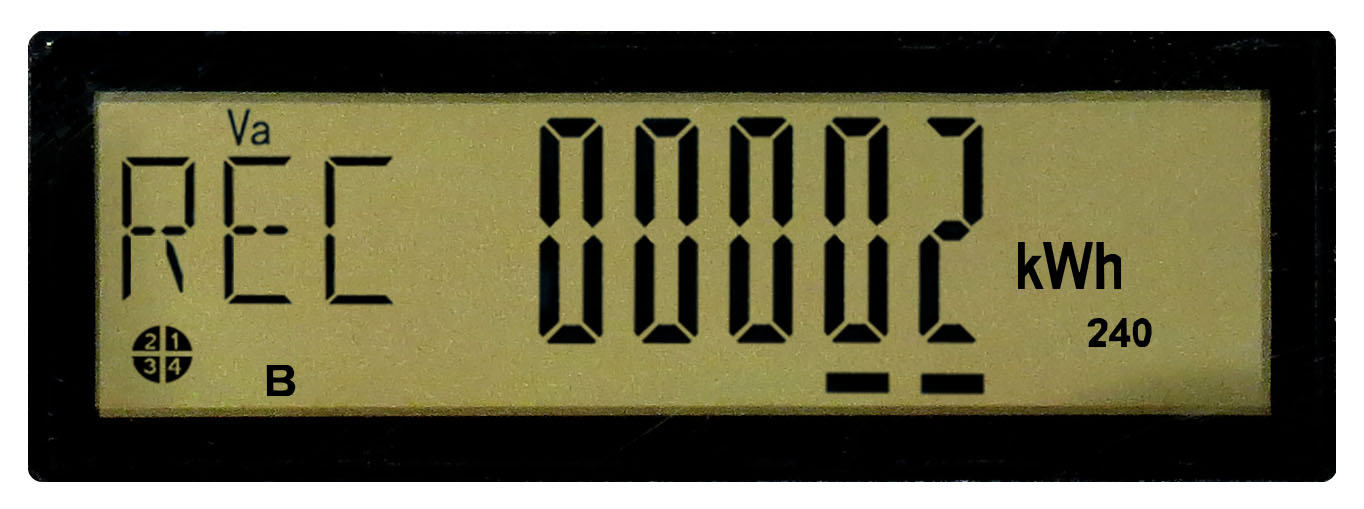
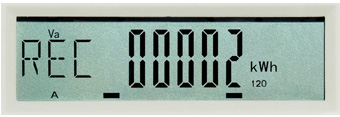
Energy injected
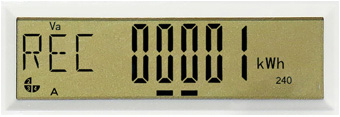
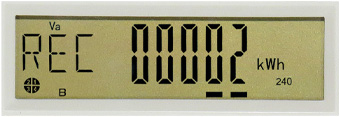
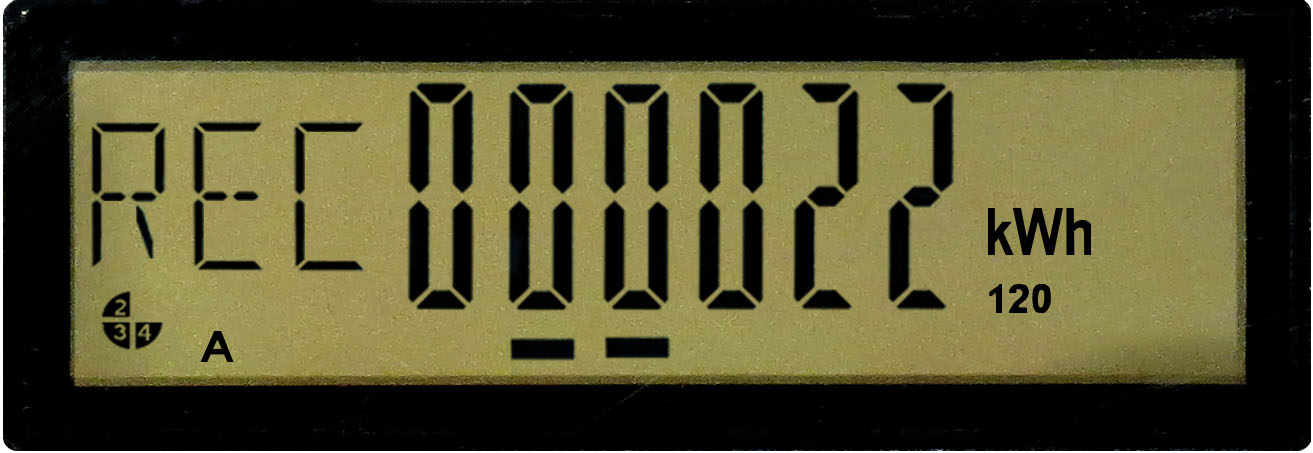
This screen, which displays the letters REC for reçu par Hydro‑Québec (received by Hydro‑Québec), indicates information for energy producers (clients enrolled in the net metering option).
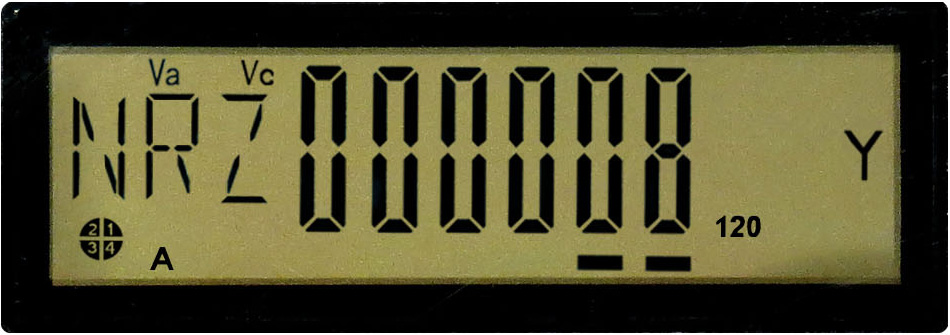
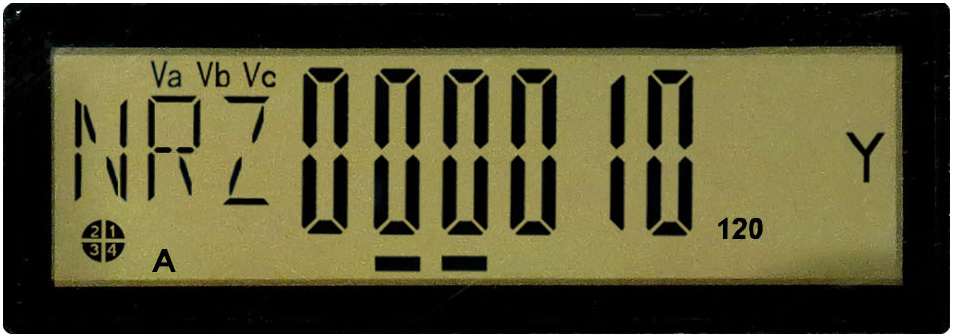
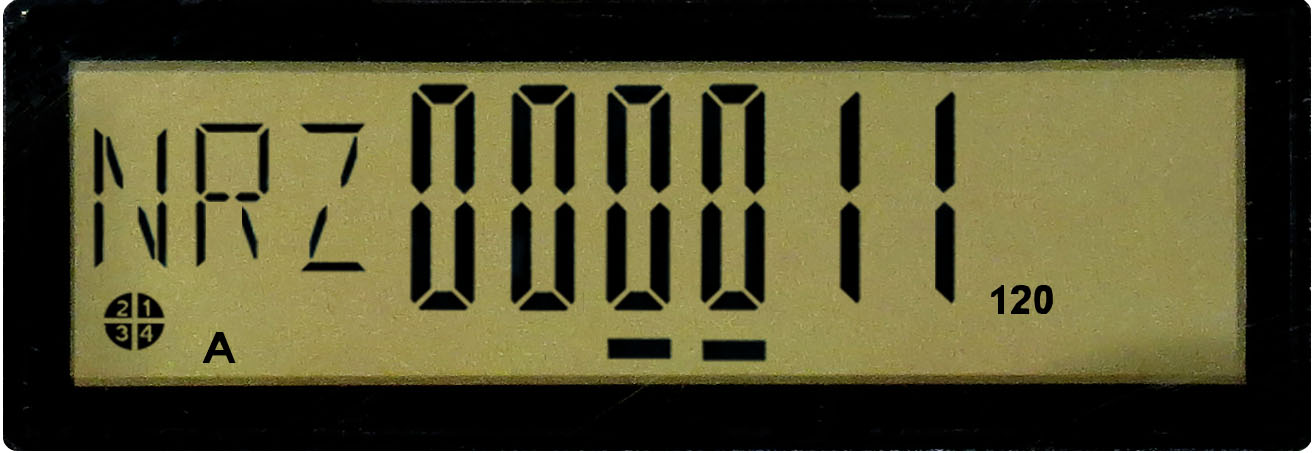
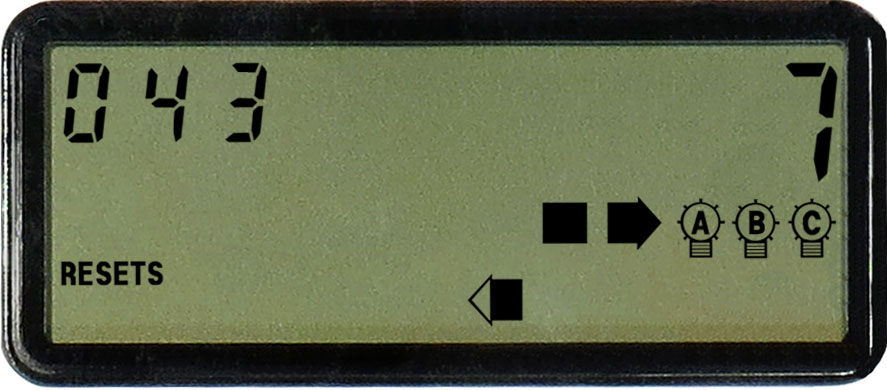
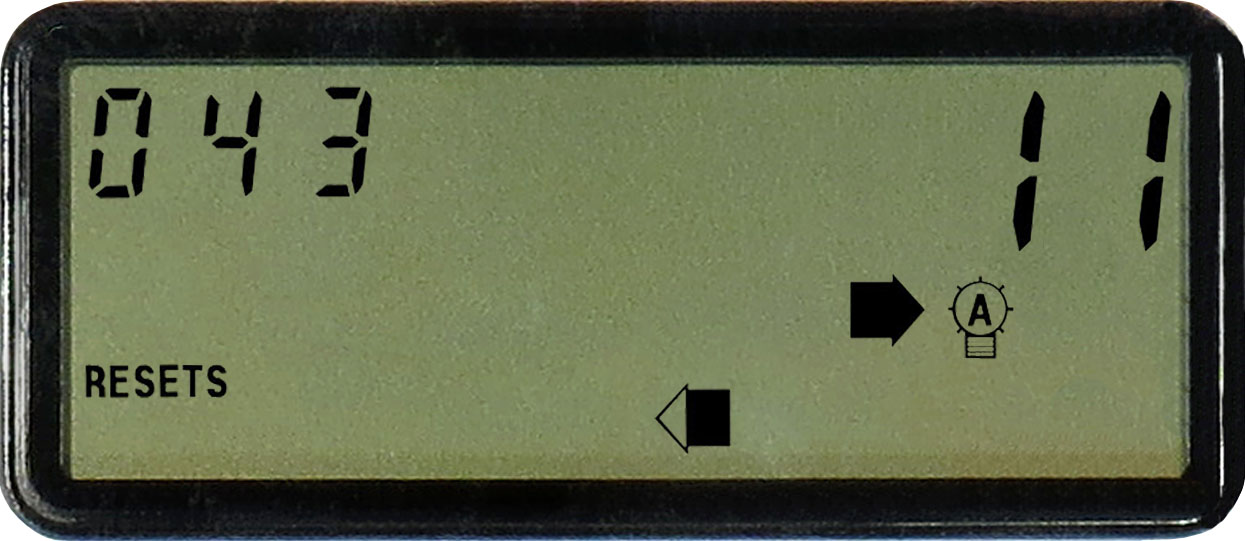
Number of resets
This data shows the number of times Hydro‑Québec has reset the power demand indicator when taking a meter reading.
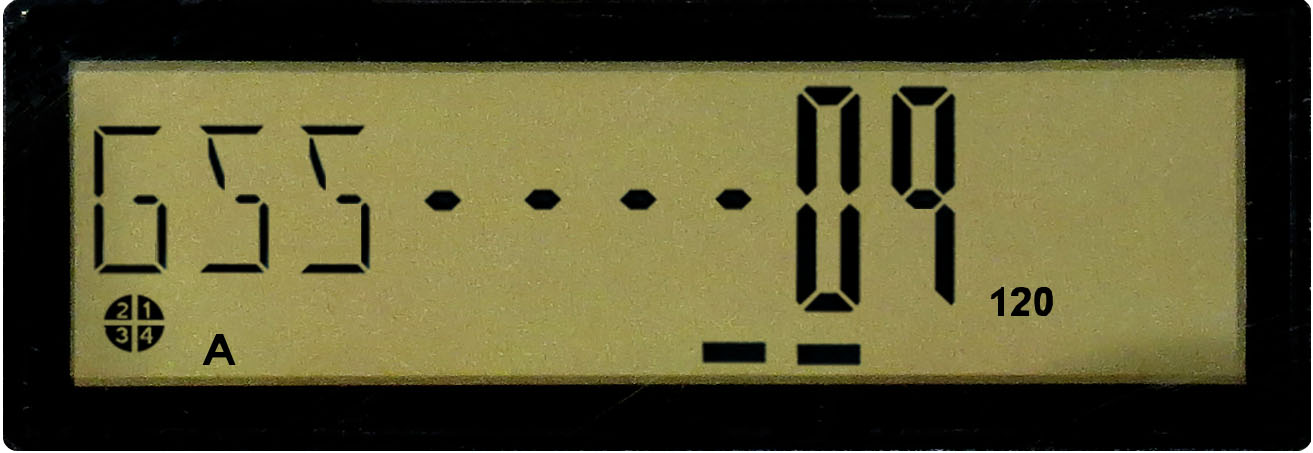
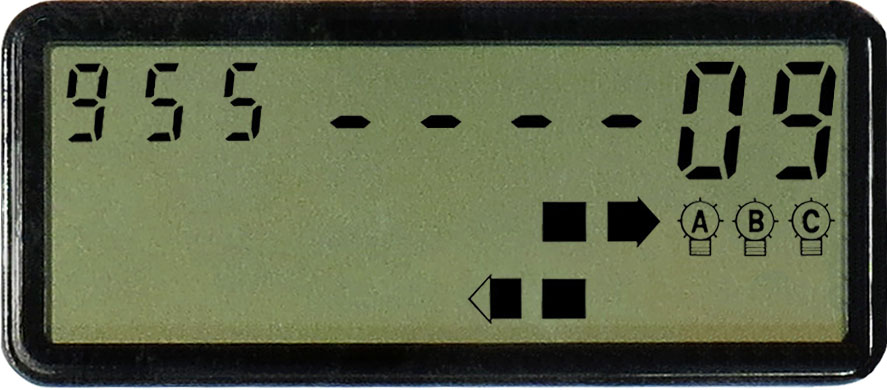
Network information
Hydro‑Québec uses this information to manage the advanced metering infrastructure system.
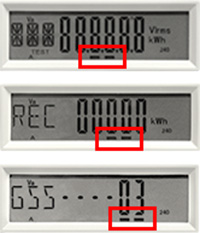
Power indicator
The indicator consists of two little lines that generally move from left to right at the bottom of the screen. The faster they move, the higher the consumption.
Below are the main displays and information that appear at regular intervals on the screen.
Display test
This screen shows that the liquid crystal display is working properly. When the 8s are displayed properly, the LCD is working.
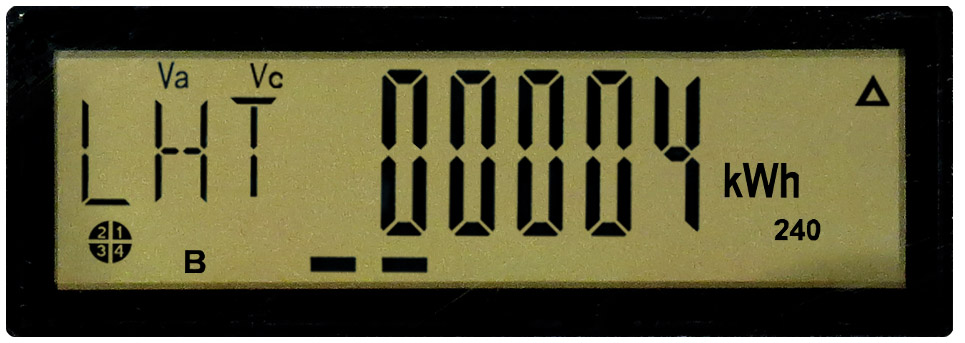
Energy consumed – higher price
This screen, which displays the letters LHT, indicates the total number of kilowatthours (kWh) measured by the meter, which are then billed at the higher of the two Rate DT prices. The meter displays kWh as a running total, much like how a car odometer displays a running total of the distance travelled. In the image, you can see the total amount of energy consumed is 4 kWh.
When the meter is first installed, it may display a value other than 0. If this is the case, the installer will note the value and it will be subtracted from your next reading so that your bill reflects your actual consumption for the period in question.
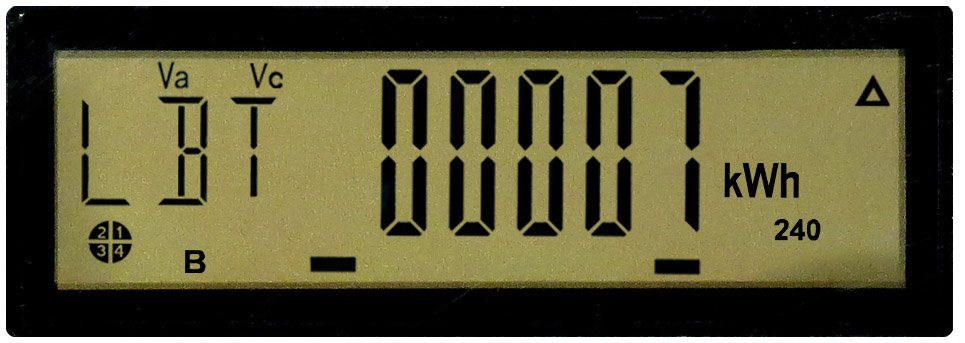
Energy consumed – lower price
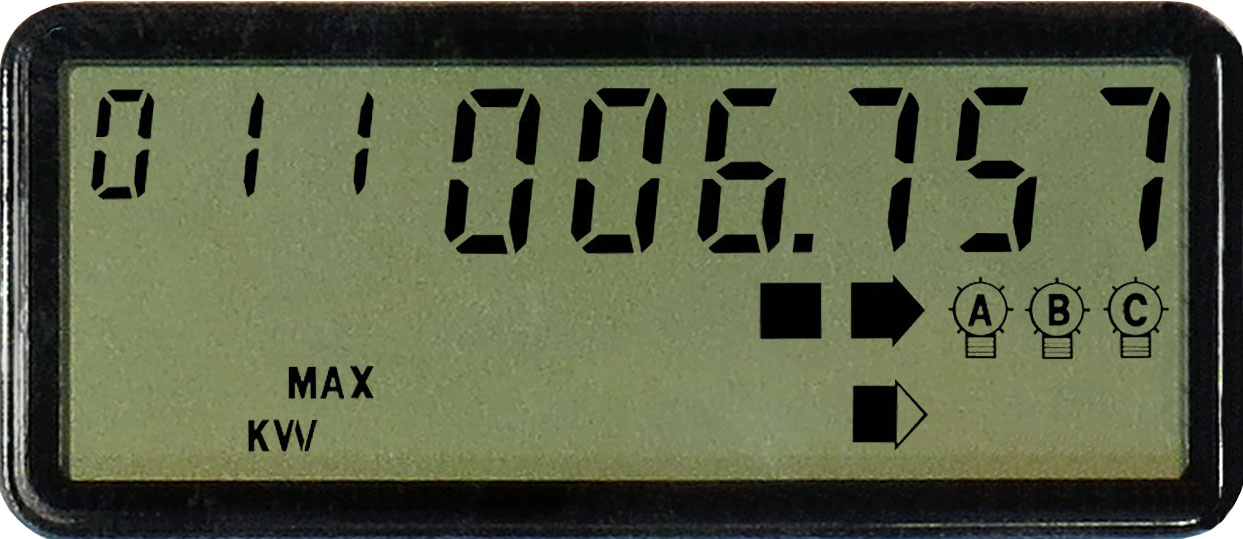
The screen, which displays the letters LBT, indicates the total number of kilowatthours (kWh) measured by the meter, which are then billed at the lower of the two Rate DT prices. The meter displays kWh as a running total, much like how a car odometer displays a running total of the distance travelled. In the image, you can see the total amount of energy consumed is 7 kWh.
When the meter is first installed, it may display a value other than 0. If this is the case, the installer will note the value and it will be subtracted from your next reading so that your bill reflects your actual consumption for the period in question.
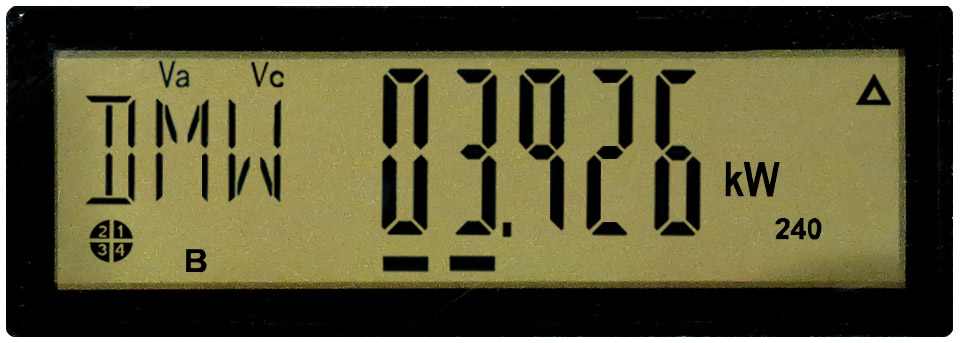
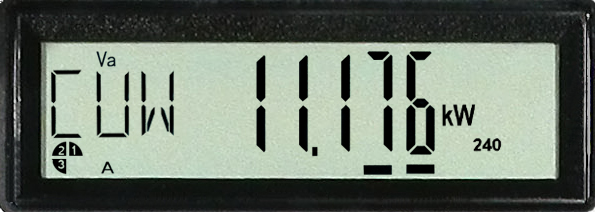
Real power
This screen displays the letters DMW for demande en watts (watt demand) and indicates the highest power demand (in kW) measured by the meter during a consumption period.
When the contract is for a rate with billed power demand, this value is reset to 0 at the start of each consumption period.
This data is used only for customers whose power demand is billed.
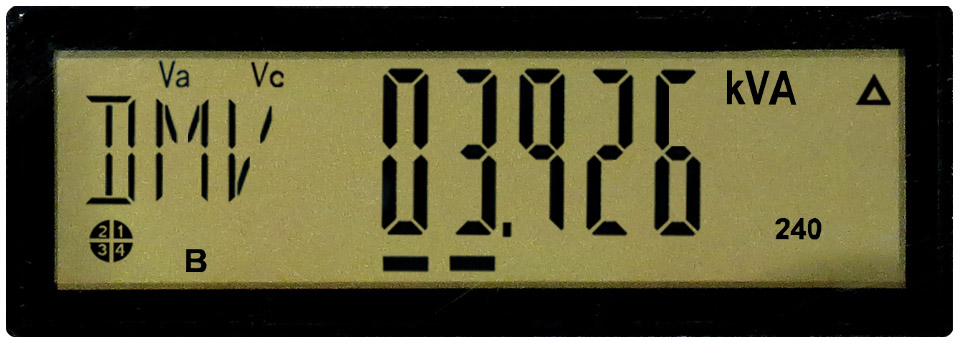
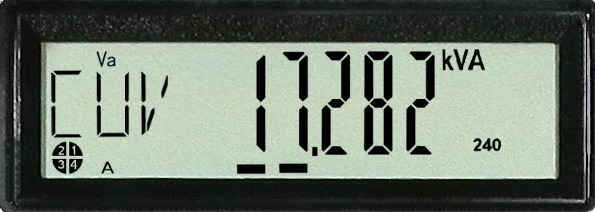
Apparent power
This screen indicates the highest power demand (in kVA) measured by the meter during a consumption period.
When the contract is for a rate with billed power demand, this value is reset to 0 at the start of each consumption period.
This data is used only for customers whose power demand is billed.
Cumulative real power
This display shows the cumulative real power for previous billing periods.
Cumulative apparent power
This display shows the cumulative apparent power for previous billing periods.
Energy injected
This screen, which displays the letters REC for reçu par Hydro‑Québec (received by Hydro‑Québec), indicates information for energy producers (clients enrolled in the net metering option).
Number of resets
This data shows the number of times Hydro‑Québec has reset the power demand indicator when taking a meter reading.
Network information
Hydro‑Québec uses this information to manage the advanced metering infrastructure system.
Power indicator
The indicator consists of two little lines that generally move from left to right at the bottom of the screen. The faster they move, the higher the consumption.
Below are the main displays and information that appear at regular intervals on the screen.
Display test
This screen shows that the liquid crystal display is working properly. When the 8s are displayed properly, the LCD is working.
Energy consumed
This screen displays the letters LIV for énergie livrée (energy delivered), indicating the total number of kilowatthours (kWh) measured by the meter. The meter displays kWh as a running total, much like how a car odometer displays a running total of the distance travelled. In the image, you can see the total amount of energy consumed is 10 kWh.
When the meter is first installed, it may display a value other than 0. If this is the case, the installer will note the value and it will be subtracted from your next reading so that your bill reflects your actual consumption for the period in question.
Real power
This screen displays the letters DMW for demande en watts (watt demand) and indicates the highest power demand (in kW) measured by the meter during a consumption period.
When the contract is for a rate with billed power demand, this value is reset to 0 at the start of each consumption period.
This data is used only for customers whose power demand is billed.
Apparent power
This screen indicates the highest power demand (in kVA) measured by the meter during a consumption period.
When the contract is for a rate with billed power demand, this value is reset to 0 at the start of each consumption period.
This data is used only for customers whose power demand is billed.
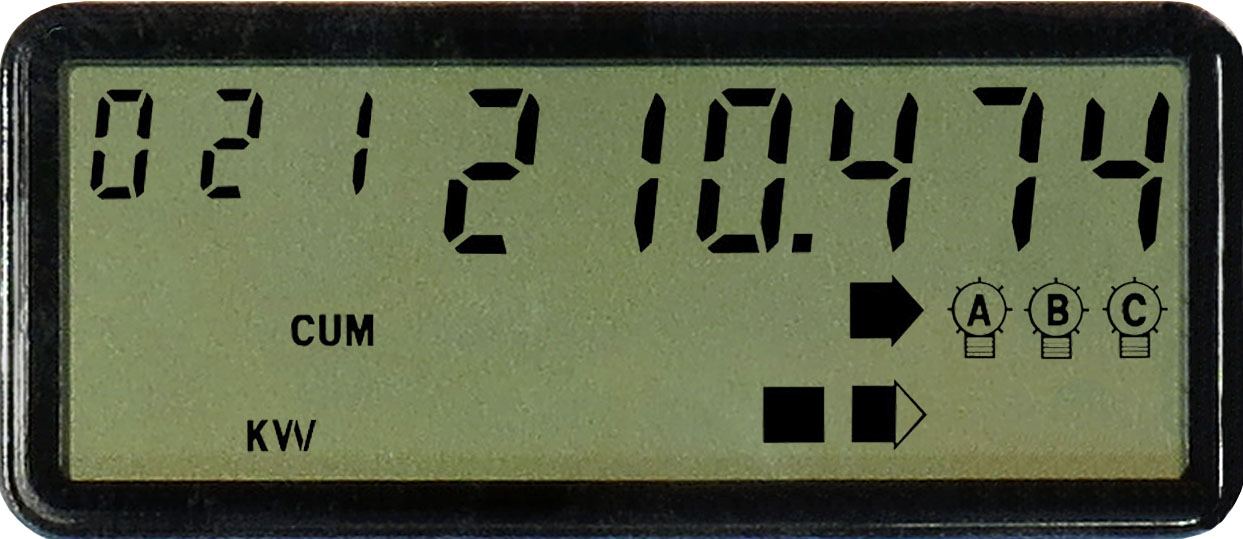
Cumulative real power
This display shows the cumulative real power for previous billing periods.
Cumulative apparent power
This display shows the cumulative apparent power for previous billing periods.
Energy injected
This screen, which displays the letters REC for reçu par Hydro‑Québec (received by Hydro‑Québec), indicates information for energy producers (clients enrolled in the net metering option).
Number of resets
This data shows the number of times Hydro‑Québec has reset the power demand indicator when taking a meter reading.
Network information
Hydro‑Québec uses this information to manage the advanced metering infrastructure system.
Power indicator
The indicator consists of two little lines that generally move from left to right at the bottom of the screen. The faster they move, the higher the consumption.
Below are the main displays and information that appear at regular intervals on the screen.
Display test
This screen shows that the liquid crystal display is working properly. When the 8s are displayed properly, the LCD is working.
Energy consumed – higher price
This screen, which displays the letters LHT, indicates the total number of kilowatthours (kWh) measured by the meter, billed at the higher of the two Rate DT prices. The meter displays kWh as a running total, much like how a car odometer displays a running total of the distance travelled. In the image, you can see the total amount of energy consumed is 8 kWh.
When the meter is first installed, it may display a value other than 0. If this is the case, the installer will note the value and subtract it from your next reading so that your bill reflects your actual consumption for the period in question.
Energy consumed – lower price
The screen, which displays the letters LBT, indicates the total number of kilowatthours (kWh) measured by the meter, billed at the lower of the two Rate DT prices. The meter displays kWh as a running total, much like how a car odometer displays a running total of the distance travelled. In the image, you can see the total amount of energy consumed is 10 kWh.
When the meter is first installed, it may display a value other than 0. If this is the case, the installer will note the value and it will be subtracted from your next reading so that your bill reflects your actual consumption for the period in question.
Real power
This screen displays the letters DMW for demande en watts (watt demand) and indicates the highest power demand (in kW) measured by the meter during a consumption period.
When the contract is for a rate with billed power demand, this value is reset to 0 at the start of each consumption period.
This data is used only for customers whose power demand is billed.
Apparent power
This screen indicates the highest power demand (in kVA) measured by the meter during a consumption period.
When the contract is for a rate with billed power demand, this value is reset to 0 at the start of each consumption period.
This data is used only for customers whose power demand is billed.
Cumulative real power
This display shows the cumulative real power for previous billing periods.
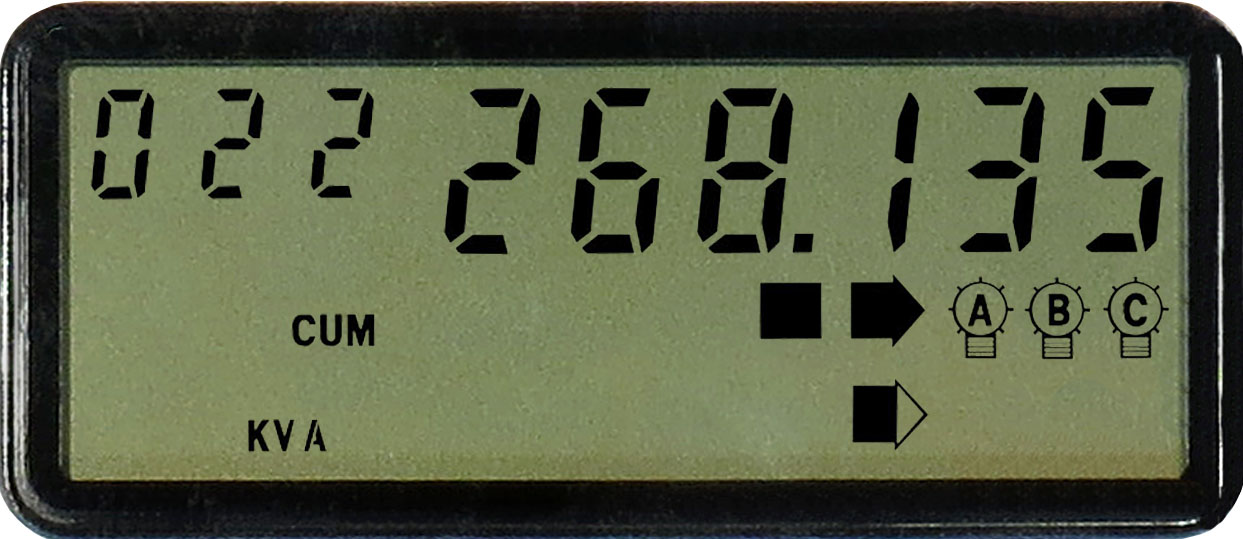
Cumulative apparent power
This display shows the cumulative apparent power for previous billing periods.

Energy injected
This screen, which displays the letters REC for reçu par Hydro‑Québec (received by Hydro‑Québec), indicates information for energy producers (clients enrolled in the net metering option).
Number of resets
This data shows the number of times Hydro‑Québec has reset the power demand indicator when taking a meter reading.
Network information
Hydro‑Québec uses this information to manage the advanced metering infrastructure system.
Power indicator
The indicator consists of two little lines that generally move from left to right at the bottom of the screen. The faster they move, the higher the consumption.
Below are the main displays and information that appear at regular intervals on the screen.
Display test
This screen shows that the liquid crystal display is working properly. When the 8s are displayed properly, the LCD is working.
Energy consumed
This screen displays the letters LIV for énergie livrée (energy delivered), indicating the total number of kilowatthours (kWh) measured by the meter. The meter displays kWh as a running total, much like how a car odometer displays a running total of the distance travelled. In the image, you can see the total amount of energy consumed is 11 kWh.
When the meter is first installed, it may display a value other than 0. If this is the case, the installer will note the value and it will be subtracted from your next reading so that your bill reflects your actual consumption for the period in question.
Real power
This screen displays the letters DMW for demande en watts (watt demand) and indicates the highest power demand (in kW) measured by the meter during a consumption period.
When the contract is for a rate with billed power demand, this value is reset to 0 at the start of each consumption period.
This data is used only for customers whose power demand is billed.
Apparent power
This screen indicates the highest power demand (in kVA) measured by the meter during a consumption period.
When the contract is for a rate with billed power demand, this value is reset to 0 at the start of each consumption period.
This data is used only for customers whose power demand is billed.
Cumulative real power
This display shows the cumulative real power for previous billing periods.
Cumulative apparent power
This display shows the cumulative apparent power for previous billing periods.
Energy injected
This screen, which displays the letters REC for reçu par Hydro‑Québec (received by Hydro‑Québec), indicates information for energy producers (clients enrolled in the net metering option).
Number of resets
This data shows the number of times Hydro‑Québec has reset the power demand indicator when taking a meter reading.
Network information
Hydro‑Québec uses this information to manage the advanced metering infrastructure system.
Power indicator
The indicator consists of two little lines that generally move from left to right at the bottom of the screen. The faster they move, the higher the consumption.
Below are the main displays and information that appear at regular intervals on the screen.
Display test
This screen shows that the liquid crystal display is working properly. When the 8s are displayed properly, the LCD is working.
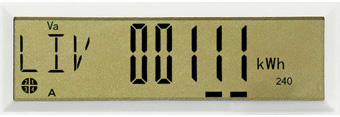
Energy consumed
This screen displays the letters LIV for énergie livrée (energy delivered), indicating the total number of kilowatthours (kWh) measured by the meter. The meter displays kWh as a running total, much like how a car odometer displays a running total of the distance travelled. In the image, you can see the total amount of energy consumed is 111 kWh.
When the meter is first installed, it may display a value other than 0. If this is the case, the installer will note the value and it will be subtracted from your next reading so that your bill reflects your actual consumption for the period in question.
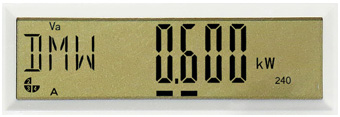
Real power
This screen displays the letters DMW for demande en watts (watt demand) and indicates the highest power demand (in kW) measured by the meter during a consumption period.
When the contract is for a rate with billed power demand, this value is reset to 0 at the start of each consumption period.
This data is used only for customers whose power demand is billed.
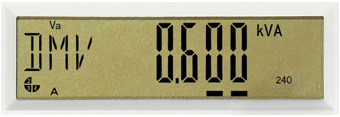
Apparent power
This screen indicates the highest power demand (in kVA) measured by the meter during a consumption period.
When the contract is for a rate with billed power demand, this value is reset to 0 at the start of each consumption period.
This data is used only for customers whose power demand is billed.
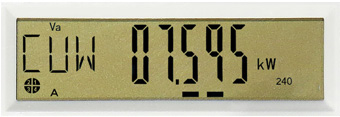
Cumulative real power
This display shows the cumulative real power for previous billing periods.
Cumulative apparent power
This display shows the cumulative apparent power for previous billing periods.
Energy injected
This screen, which displays the letters REC for reçu par Hydro‑Québec (received by Hydro‑Québec), indicates information for energy producers (clients enrolled in the net metering option).
Number of resets
This data shows the number of times Hydro‑Québec has reset the power demand indicator when taking a meter reading.
Network information
Hydro‑Québec uses this information to manage the advanced metering infrastructure system.
Power indicator
The indicator consists of two little lines that generally move from left to right at the bottom of the screen. The faster they move, the higher the consumption.
Below are the main displays and information that appear at regular intervals on the screen.
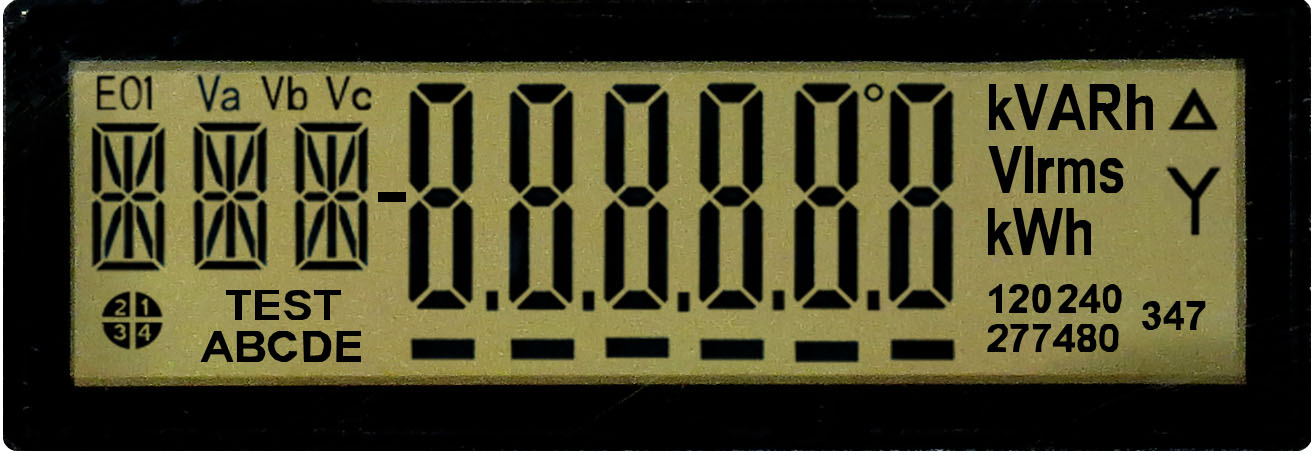
Display test
This screen shows that the liquid crystal display is working properly. When the 8s are displayed properly, the LCD is working.
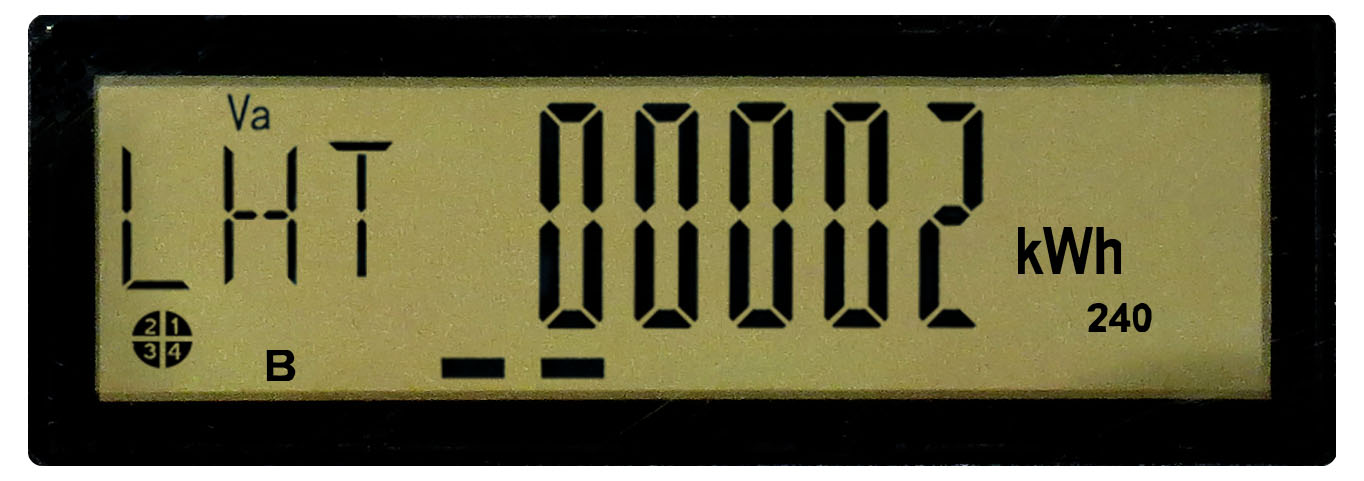
Energy consumed – higher price
This screen, which displays the letters LHT, indicates the total number of kilowatthours (kWh) measured by the meter, billed at the higher of the two Rate DT prices. The meter displays kWh as a running total, much like how a car odometer displays a running total of the distance travelled. In the image, you can see the total amount of energy consumed is 2 kWh.
When the meter is first installed, it may display a value other than 0. If this is the case, the installer will note the value and it will be subtracted from your next reading so that your bill reflects your actual consumption for the period in question.
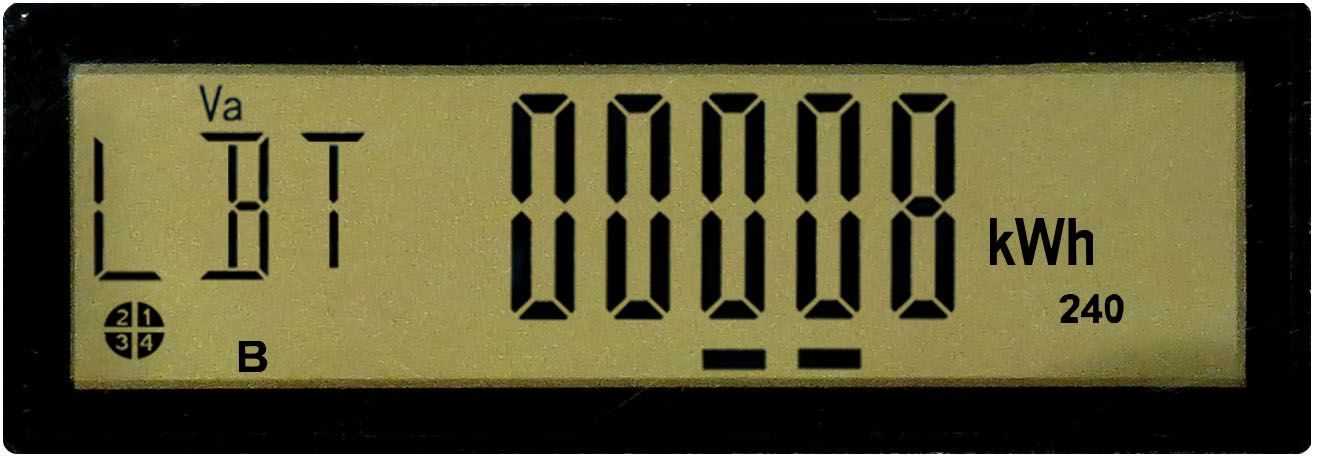
Energy consumed – lower price
The screen, which displays the letters LBT, indicates the total number of kilowatthours (kWh) measured by the meter, billed at the lower of the two Rate DT prices. The meter displays kWh as a running total, much like how a car odometer displays a running total of the distance travelled. In the image, you can see the total amount of energy consumed is 8 kWh.
When the meter is first installed, it may display a value other than 0. If this is the case, the installer will note the value and it will be subtracted from your next reading so that your bill reflects your actual consumption for the period in question.
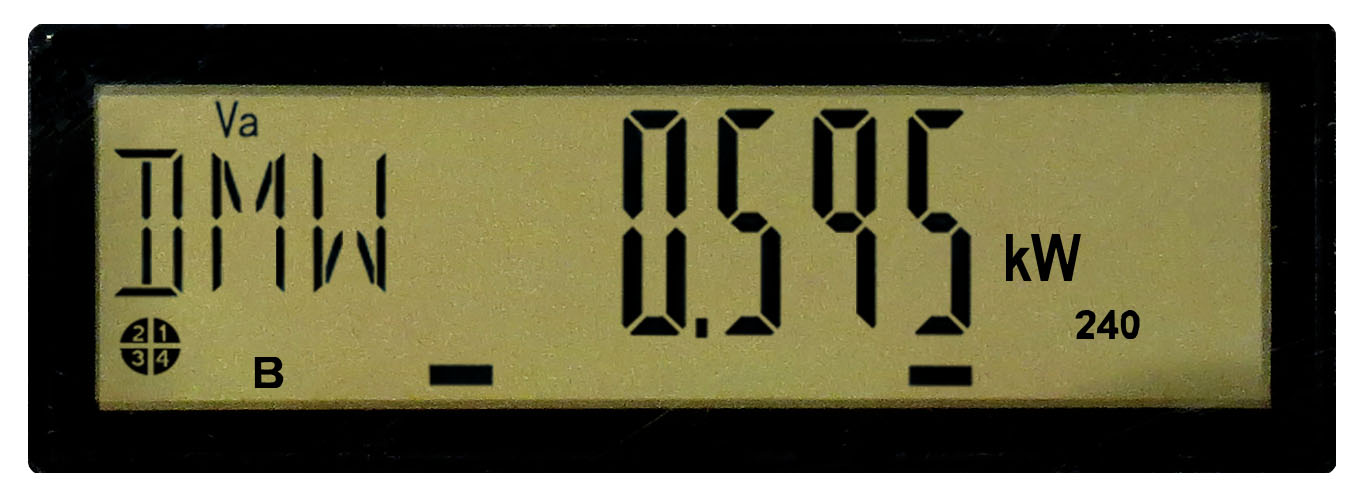
Real power
This screen displays the letters DMW for demande en watts (watt demand) and indicates the highest power demand (in kW) measured by the meter during a consumption period.
When the contract is for a rate with billed power demand, this value is reset to 0 at the start of each consumption period.
This data is used only for customers whose power demand is billed.
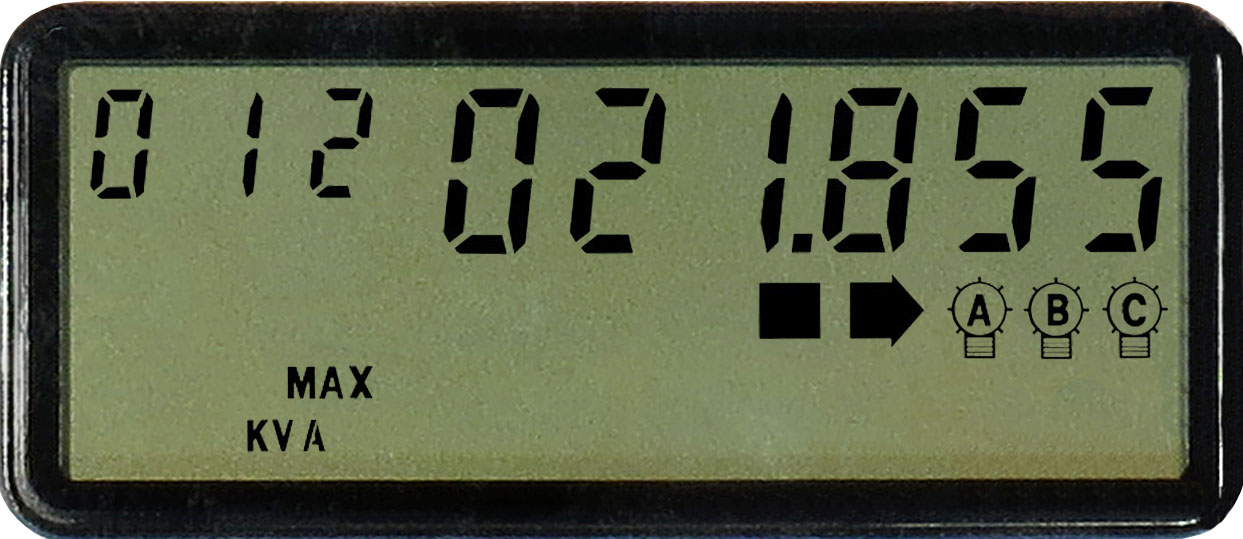
Apparent power
This screen indicates the highest power demand (in kVA) measured by the meter during a consumption period.
When the contract is for a rate with billed power demand, this value is reset to 0 at the start of each consumption period.
This data is used only for customers whose power demand is billed.
Cumulative real power
This display shows the cumulative real power for previous billing periods.
Cumulative apparent power
This display shows the cumulative apparent power for previous billing periods.
Energy injected
This screen, which displays the letters REC for reçu par Hydro‑Québec (received by Hydro‑Québec), indicates information for energy producers (clients enrolled in the net metering option).
Number of resets
This data shows the number of times Hydro‑Québec has reset the power demand indicator when taking a meter reading.
Network information
Hydro‑Québec uses this information to manage the advanced metering infrastructure system.
Power indicator
The indicator consists of two little lines that generally move from left to right at the bottom of the screen. The faster they move, the higher the consumption.
Below are the main displays and information that appear at regular intervals on the screen.
Display test
This screen shows that the liquid crystal display is working properly. When the 8s are displayed properly, the LCD is working.
Energy consumed
This screen displays the letters LIV for énergie livrée (energy delivered), indicating the total number of kilowatthours (kWh) measured by the meter. The meter displays kWh as a running total, much like how a car odometer displays a running total of the distance travelled. In the image, you can see the total amount of energy consumed is 5 kWh.
When the meter is first installed, it may display a value other than 0. If this is the case, the installer will note the value and it will be subtracted from your next reading so that your bill reflects your actual consumption for the period in question.
Real power
This screen displays the letters DMW for demande en watts (watt demand) and indicates the highest power demand (in kW) measured by the meter during a consumption period.
This information is not used for billing purposes.
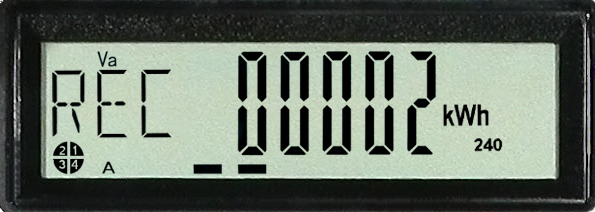
Energy injected
This screen, which displays the letters REC for reçu par Hydro‑Québec (received by Hydro‑Québec), indicates information for energy producers (clients enrolled in the net metering option).
Network information
Hydro‑Québec uses this information to manage the advanced metering infrastructure system.
Power indicator
The indicator consists of two little lines that generally move from left to right at the bottom of the screen. The faster they move, the higher the consumption.
Below are the main displays and information that appear at regular intervals on the screen.
Display test
This screen shows that the liquid crystal display is working properly. When the 8s are displayed properly, the LCD is working.
Energy consumed
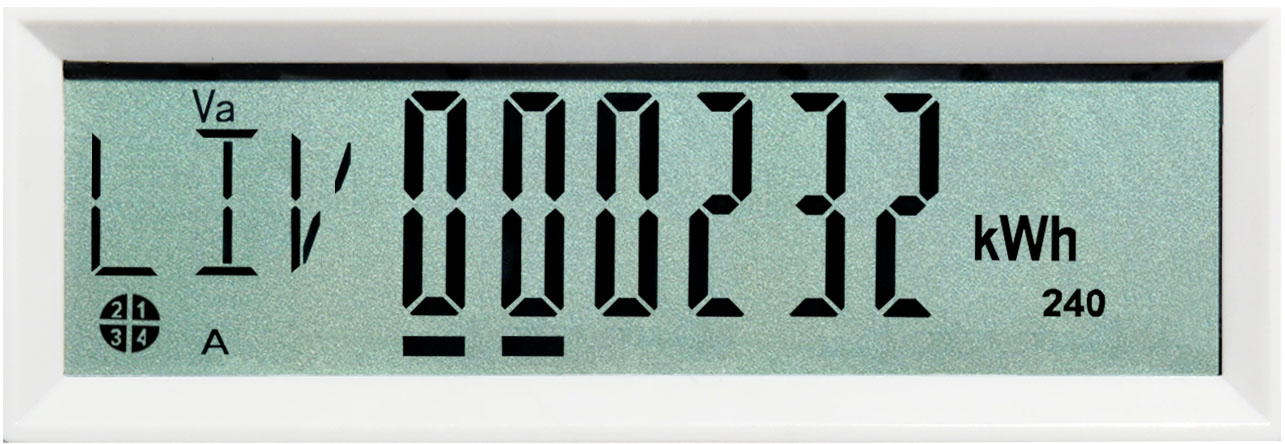
This screen displays the letters LIV for énergie livrée (energy delivered), indicating the total number of kilowatthours (kWh) measured by the meter. The meter displays kWh as a running total, much like how a car odometer displays a running total of the distance travelled. In the image, you can see the total amount of energy consumed is 232 kWh.
When the meter is first installed, it may display a value other than 0. If this is the case, the installer will note the value and it will be subtracted from your next reading so that your bill reflects your actual consumption for the period in question.
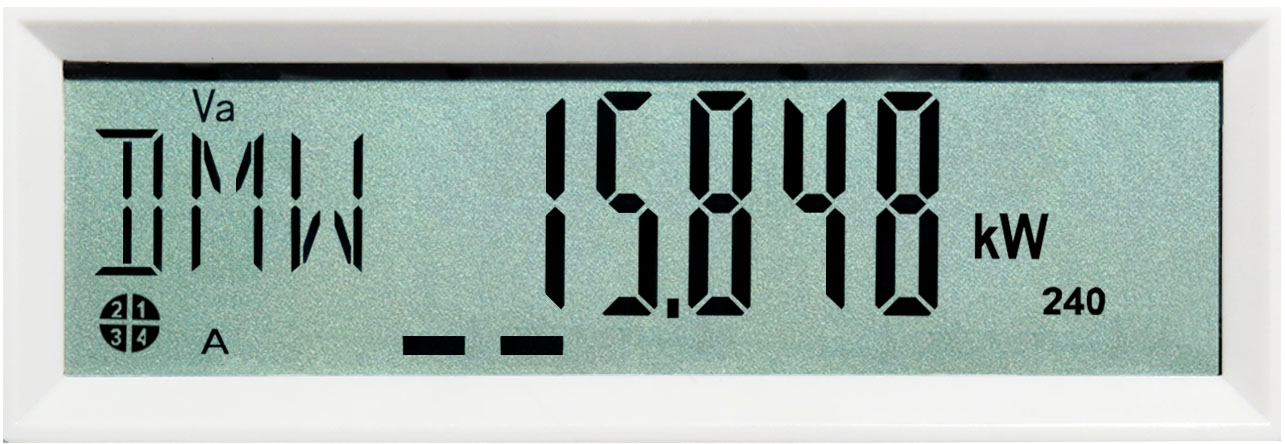
Real power
This screen displays the letters DMW for demande en watts (watt demand) and indicates the highest power demand (in kW) measured by the meter during a consumption period.
When the contract is for a rate with billed power demand, this value is reset to 0 at the start of each consumption period.
This data is used only for customers whose power demand is billed.
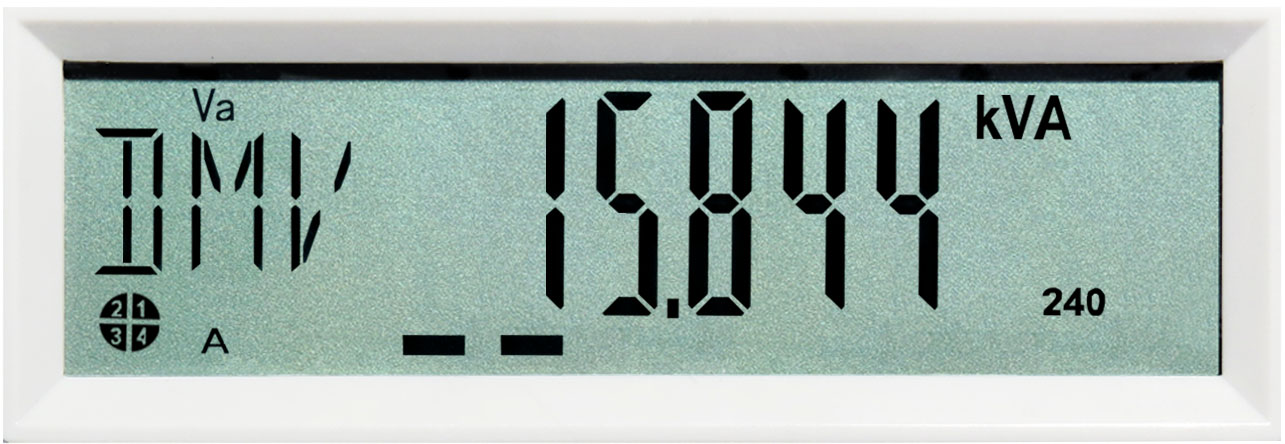
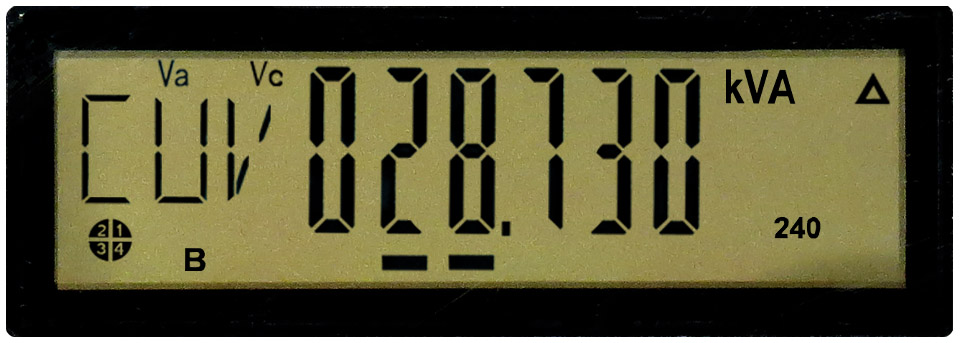
Apparent power
This screen indicates the highest power demand (in kVA) measured by the meter during a consumption period.
When the contract is for a rate with billed power demand, this value is reset to 0 at the start of each consumption period.
This data is used only for customers whose power demand is billed.
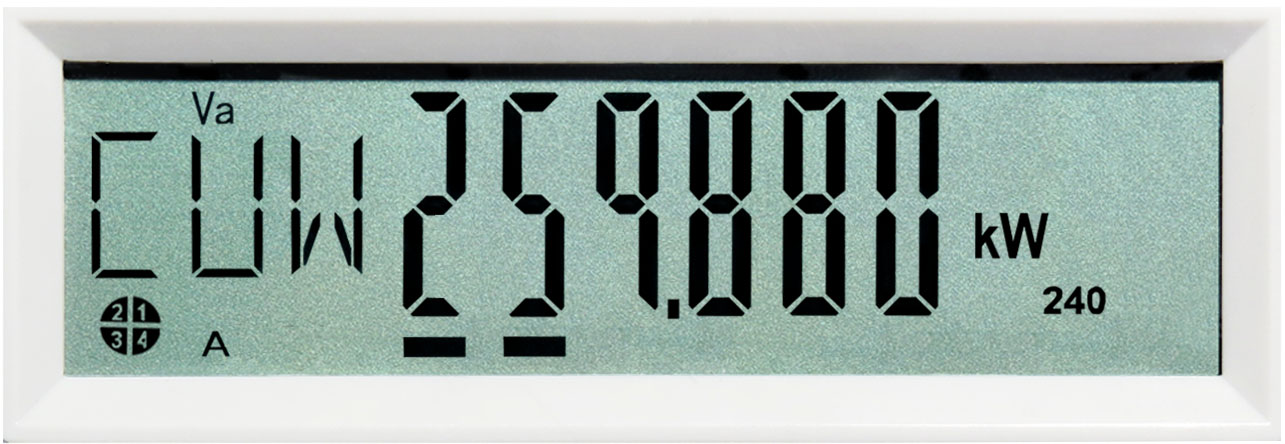
Cumulative real power
This display shows the cumulative real power for previous billing periods.
Cumulative apparent power
This display shows the cumulative apparent power for previous billing periods.
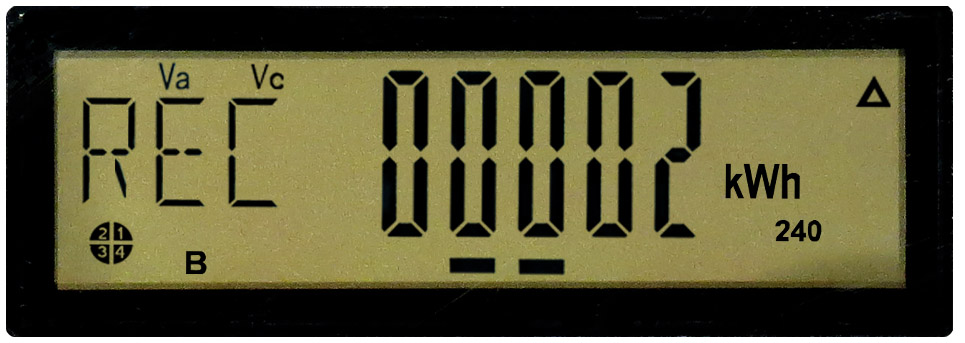
Energy injected
This screen, which displays the letters REC for reçu par Hydro‑Québec (received by Hydro‑Québec), indicates information for energy producers (clients enrolled in the net metering option).
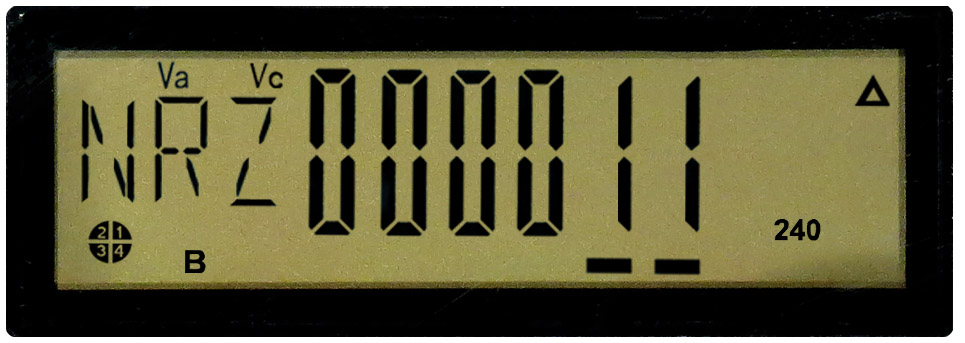
Number of resets
This data shows the number of times Hydro‑Québec has reset the power demand indicator when taking a meter reading.
Network information
Hydro‑Québec uses this information to manage the advanced metering infrastructure system.
Power indicator
The indicator consists of two little lines that generally move from left to right at the bottom of the screen. The faster they move, the higher the consumption.
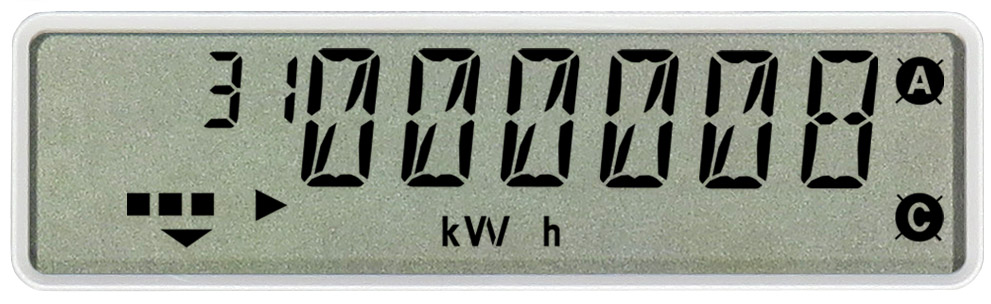
Below are the main displays and information that appear at regular intervals on the screen.
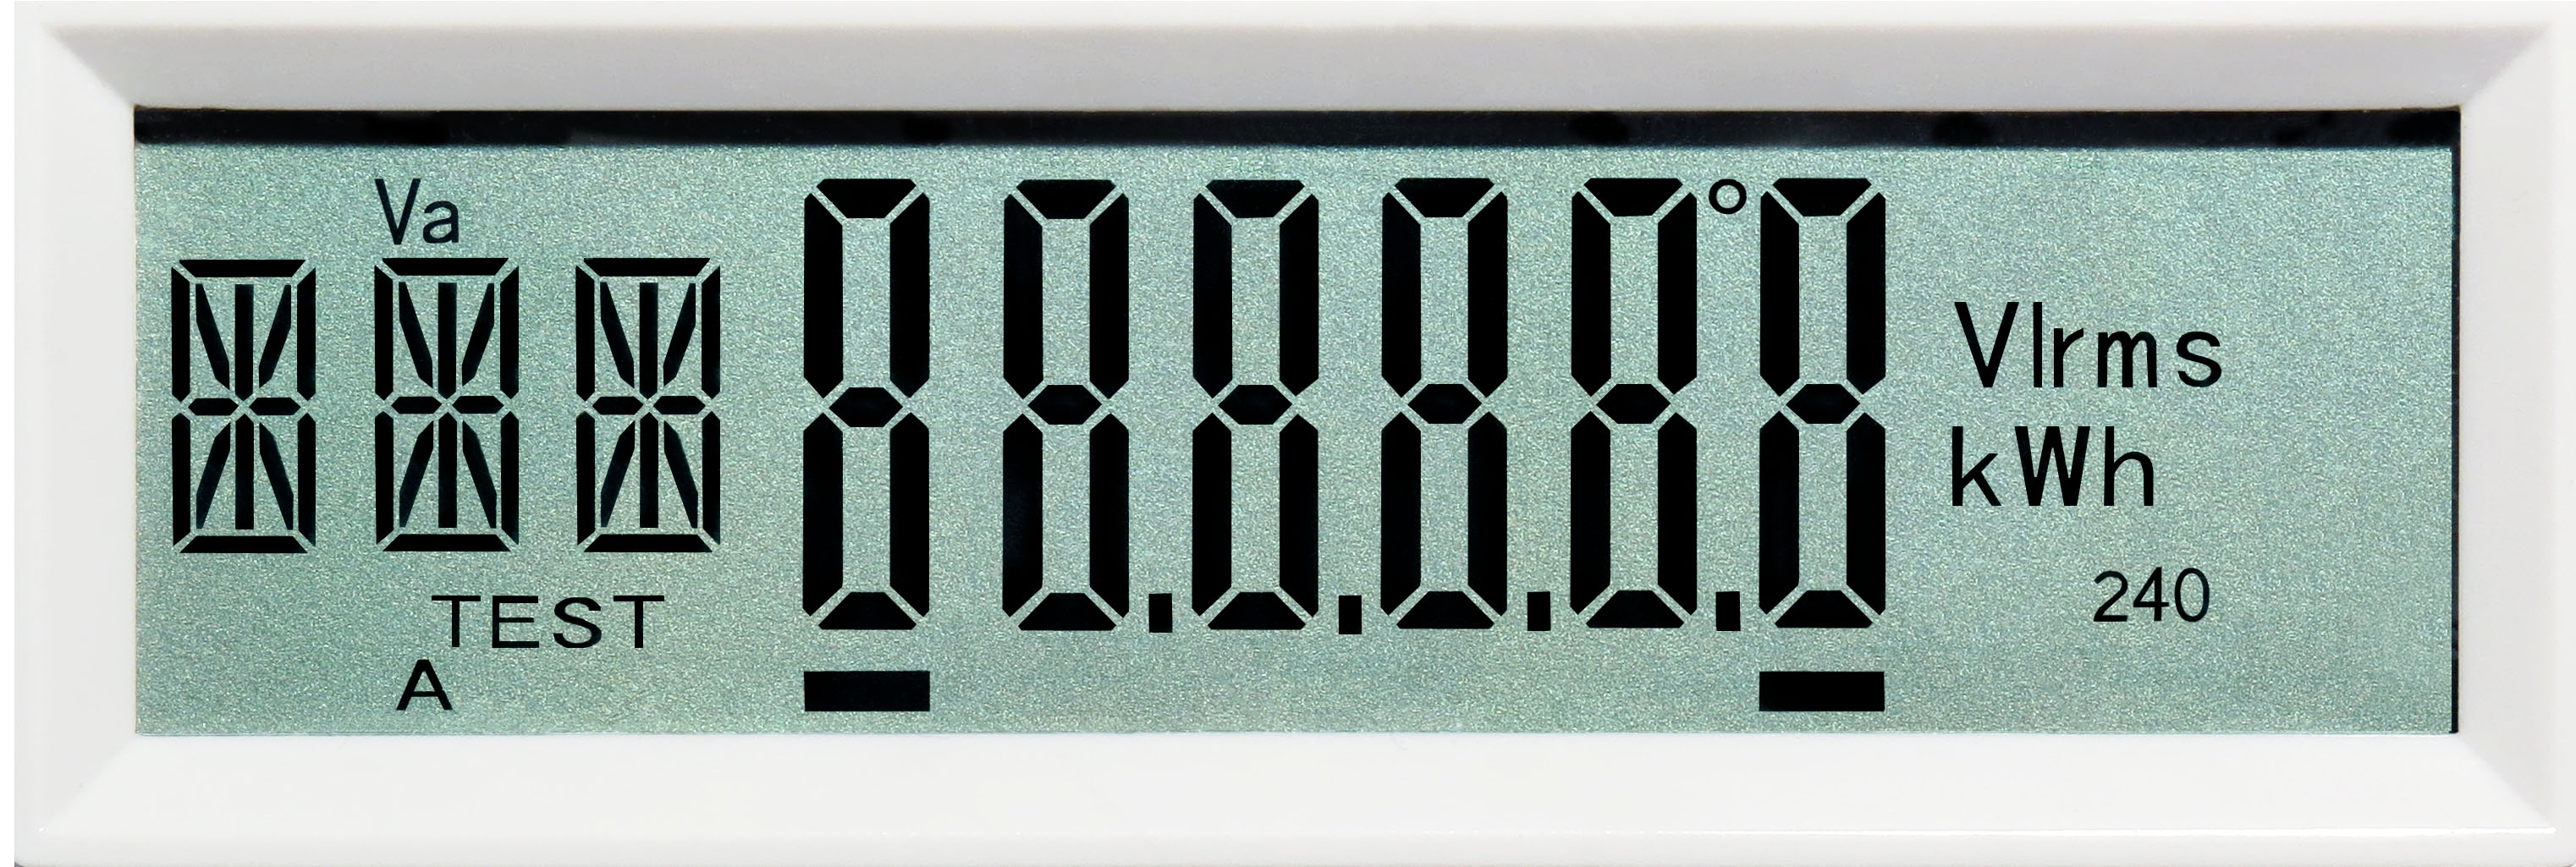
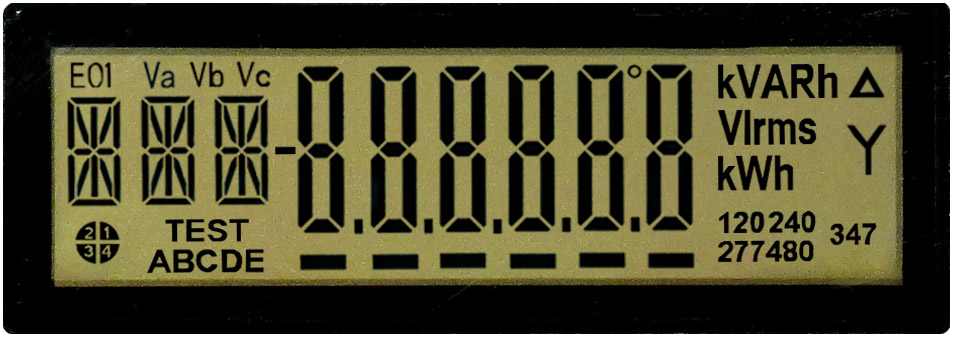
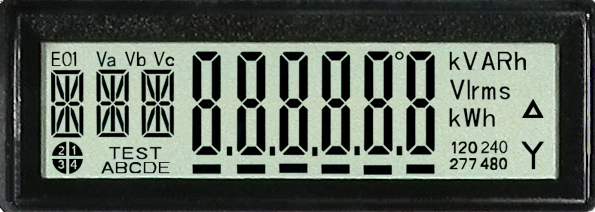
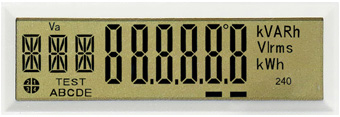
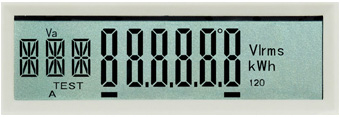
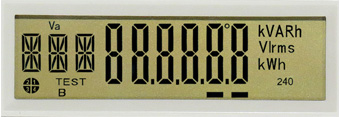
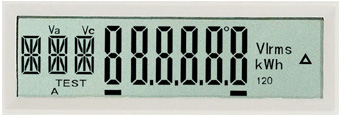
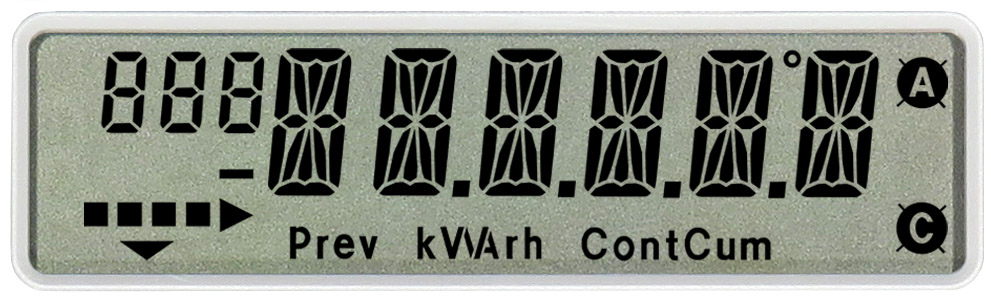
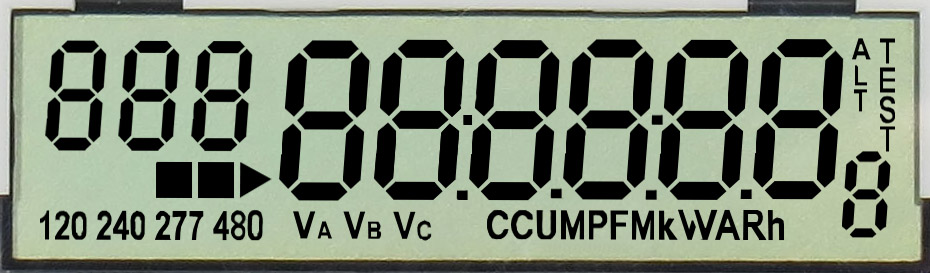
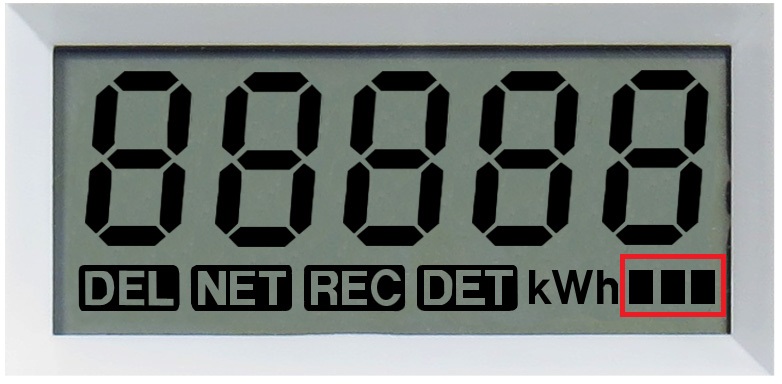
Display test
This screen shows that the liquid crystal display is working properly. When the three Xs and all the 8s are displayed properly, the LCD is working.
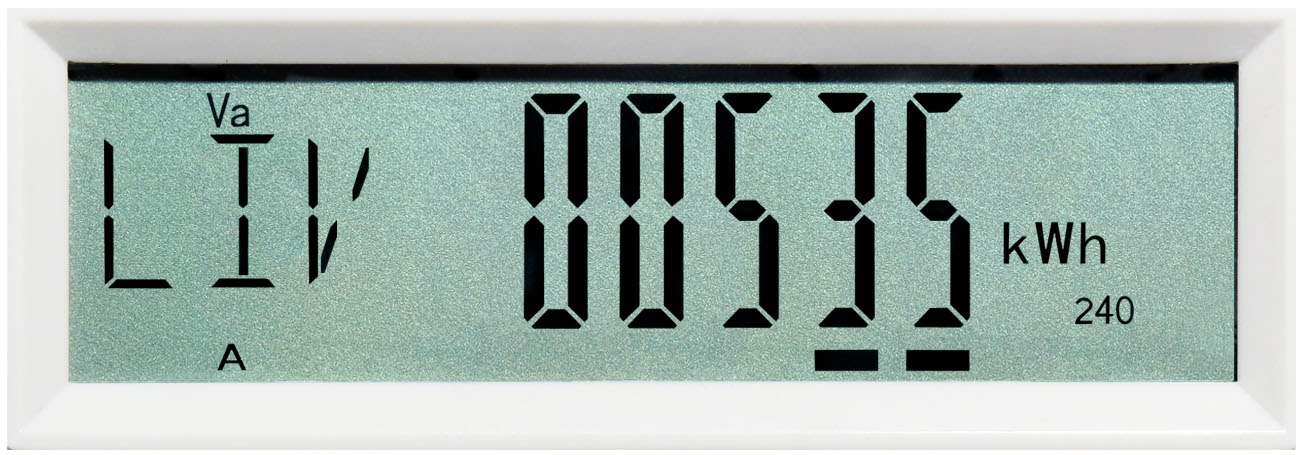
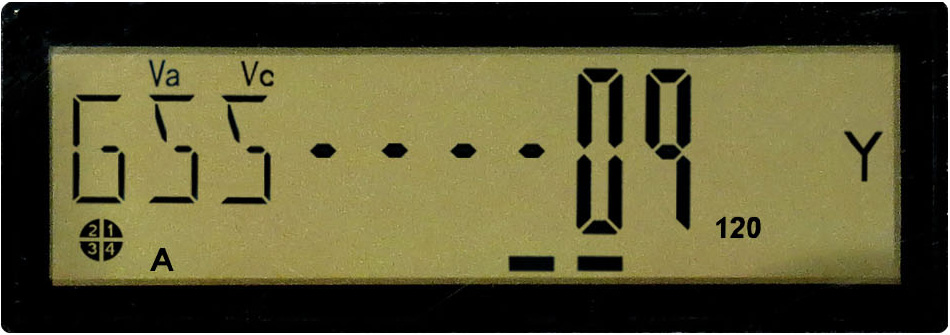
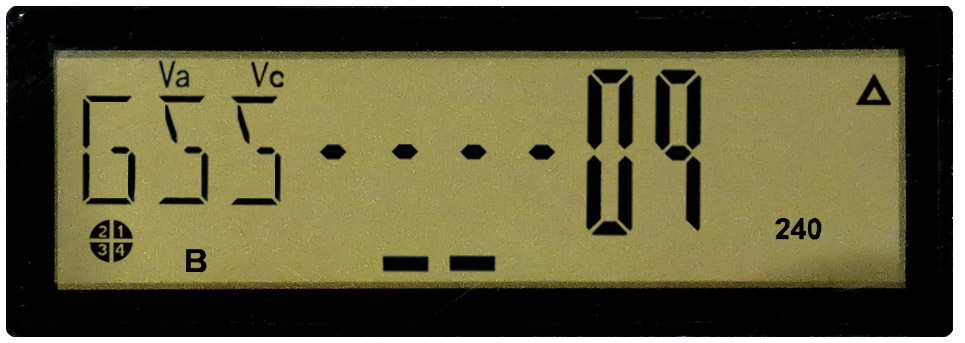
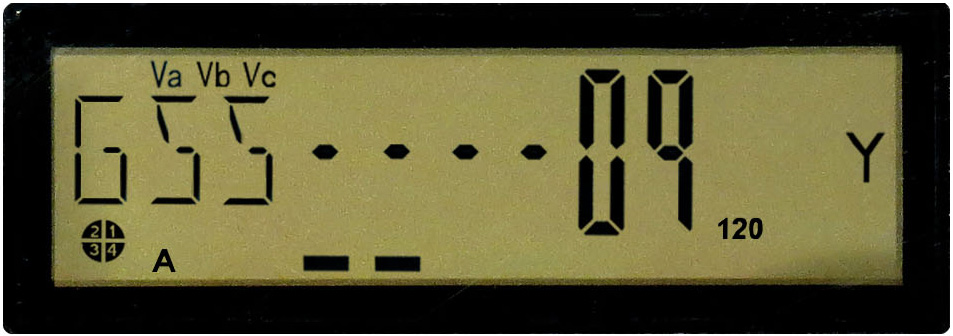
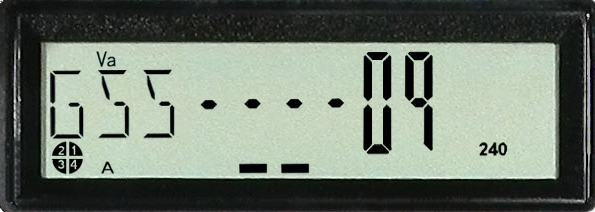
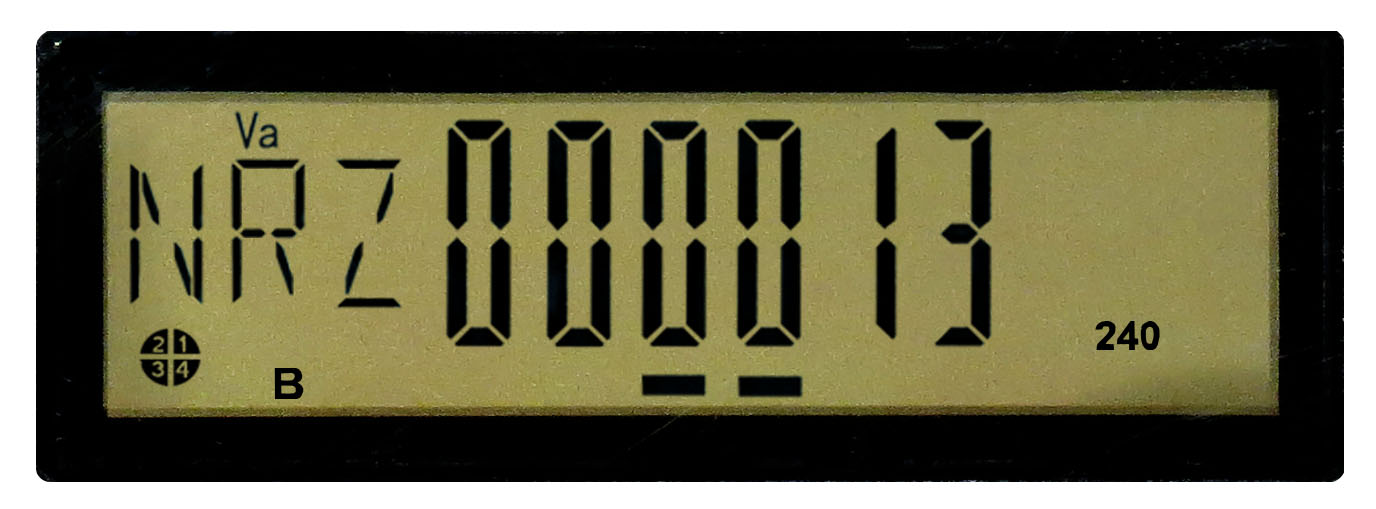
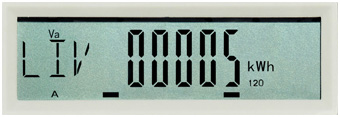
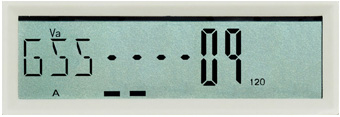
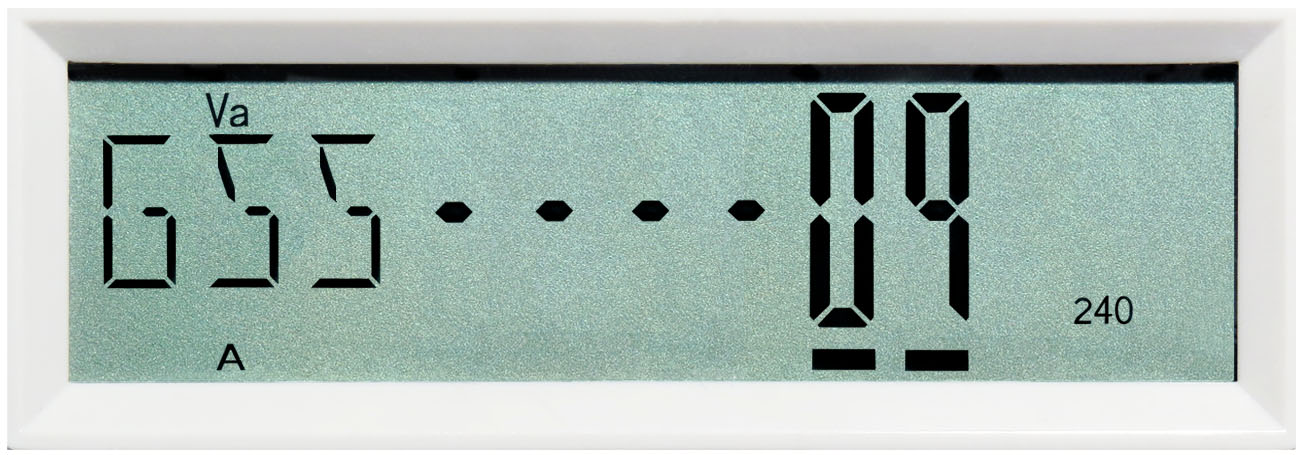
Energy consumed
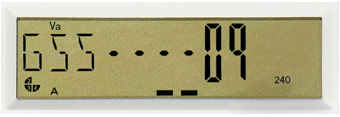
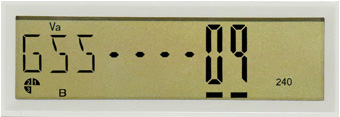
This screen displays the letters LIV for énergie livrée (energy delivered), indicating the total number of kilowatthours (kWh) measured by the meter. The meter displays kWh as a running total, much like how a car odometer displays a running total of the distance travelled. In the image, you can see the total amount of energy consumed is 535 kWh.
When the meter is first installed, it may display a value other than 0. If this is the case, the installer will note the value and it will be subtracted from your next reading so that your bill reflects your actual consumption for the period in question.
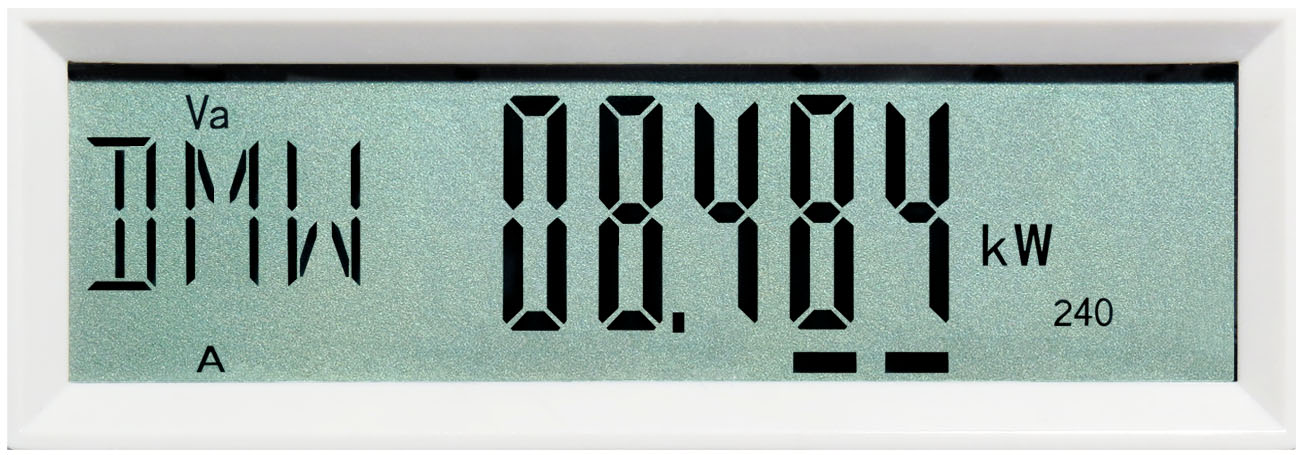
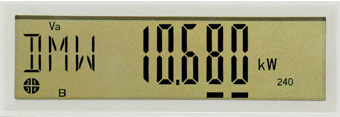
Real power
This screen displays the letters DMW for demande en watts (watt demand) and indicates the highest power demand (in kW) measured by the meter during a consumption period.
This information is not used for billing purposes.
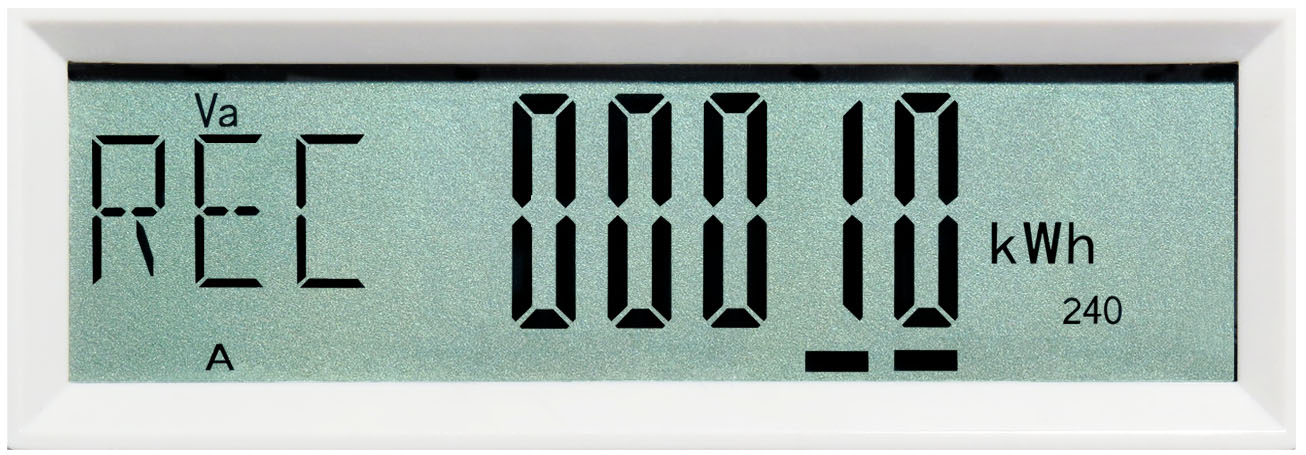
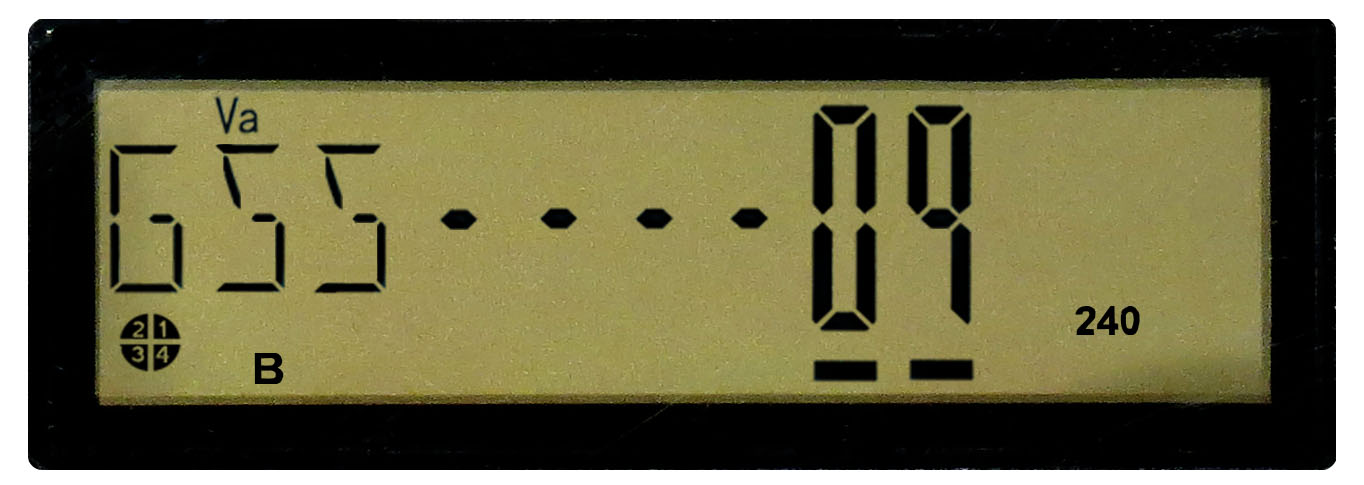
Energy injected
This screen, which displays the letters REC for reçu par Hydro‑Québec (received by Hydro‑Québec), indicates information for energy producers (clients enrolled in the net metering option).
Network information
Hydro‑Québec uses this information to manage the advanced metering infrastructure system.
Power indicator
The indicator consists of two little lines that generally move from left to right at the bottom of the screen. The faster they move, the higher the consumption.
Below are the main displays and information that appear at regular intervals on the screen.
Display test
This screen shows that the liquid crystal display is working properly. When the 8s are displayed properly, the LCD is working.
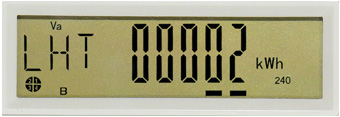
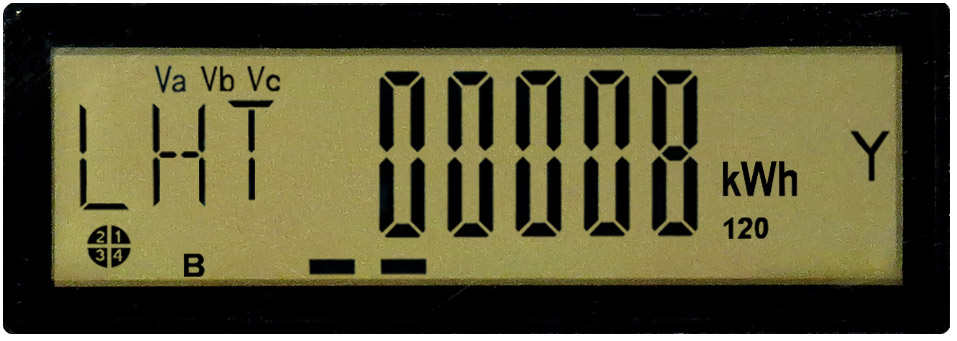
Energy consumed – Higher price
This screen, which displays the letters LHT, indicates the total number of kilowatthours (kWh) billed at the higher of the two Rate DT prices. The meter displays kWh as a running total, much like how a car odometer displays a running total of the distance travelled. In the image, you can see the total amount of energy consumed is 2 kWh.
When the meter is first installed, it may display a value other than 0. If this is the case, the installer will note the value and it will be subtracted from your next reading so that your bill reflects your actual consumption for the period in question.

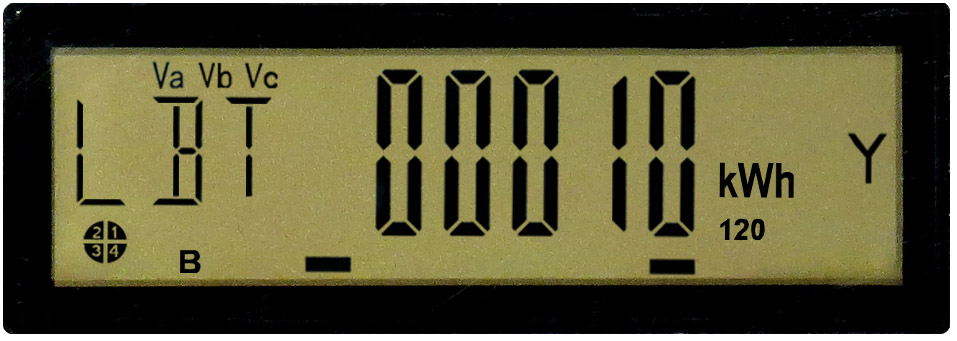
Energy consumed – lower price
The screen, which displays the letters LBT, indicates the total number of kilowatthours (kWh) measured by the meter, billed at the lower of the two Rate DT prices. The meter displays kWh as a running total, much like how a car odometer displays a running total of the distance travelled. In the image, you can see the total amount of energy consumed is 10 kWh.
When the meter is first installed, it may display a value other than 0. If this is the case, the installer will note the value and it will be subtracted from your next reading so that your bill reflects your actual consumption for the period in question.
Real power
This screen displays the letters DMW for demande en watts (watt demand) and indicates the highest power demand (in kW) measured by the meter during a consumption period.
This information is not used for billing purposes.
Energy injected
This screen, which displays the letters REC for reçu par Hydro‑Québec (received by Hydro‑Québec), indicates information for energy producers (clients enrolled in the net metering option).
Network information
Hydro‑Québec uses this information to manage the advanced metering infrastructure system.
Power indicator
The indicator consists of two little lines that generally move from left to right at the bottom of the screen. The faster they move, the higher the consumption.
Below are the main displays and information that appear at regular intervals on the screen.
Display test
This screen shows that the liquid crystal display is working properly. When the 8s are displayed properly, the LCD is working.
Energy consumed
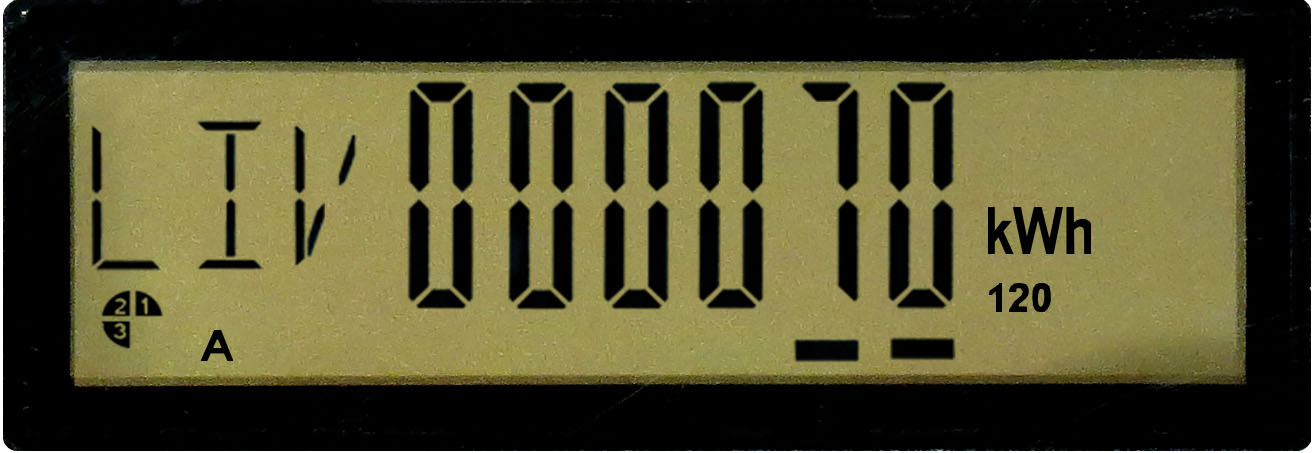
This screen displays the letters LIV for énergie livrée (energy delivered), indicating the total number of kilowatthours (kWh) measured by the meter. The meter displays kWh as a running total, much like how a car odometer displays a running total of the distance travelled. In the image, you can see the total amount of energy consumed is 70 kWh.
When the meter is first installed, it may display a value other than 0. If this is the case, the installer will note the value and it will be subtracted from your next reading so that your bill reflects your actual consumption for the period in question.
Real power
This screen displays the letters DMW for demande en watts (watt demand) and indicates the highest power demand (in kW) measured by the meter during a consumption period.
When the contract is for a rate with billed power demand, this value is reset to 0 at the start of each consumption period.
This data is used only for customers whose power demand is billed.
Apparent power
This screen indicates the highest power demand (in kVA) measured by the meter during a consumption period.
When the contract is for a rate with billed power demand, this value is reset to 0 at the start of each consumption period.
This data is used only for customers whose power demand is billed.
Cumulative real power
This display shows the cumulative real power for previous billing periods.
Cumulative apparent power
This display shows the cumulative apparent power for previous billing periods.
Energy injected
This screen, which displays the letters REC for reçu par Hydro‑Québec (received by Hydro‑Québec), indicates information for energy producers (clients enrolled in the net metering option).
Number of resets
This data shows the number of times Hydro‑Québec has reset the power demand indicator when taking a meter reading.
Network information
Hydro‑Québec uses this information to manage the advanced metering infrastructure system.
Power indicator
The indicator consists of two little lines that generally move from left to right at the bottom of the screen. The faster they move, the higher the consumption.
Below are the main displays and information that appear at regular intervals on the screen.
Display test
This screen shows that the liquid crystal display is working properly. When the 8s are displayed properly, the LCD is working.
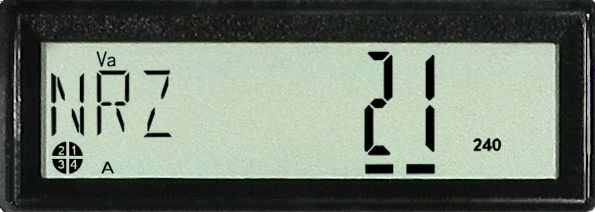
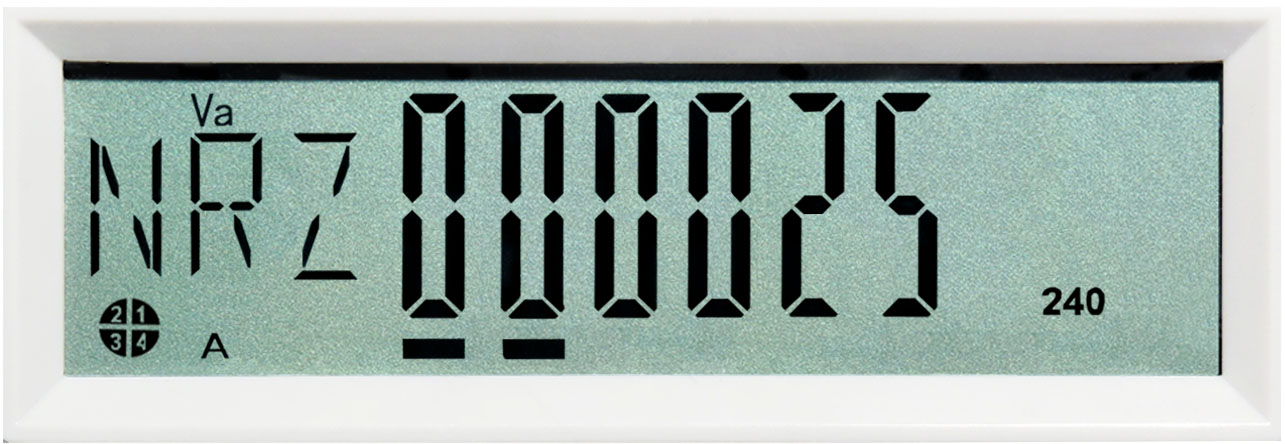
Energy consumed
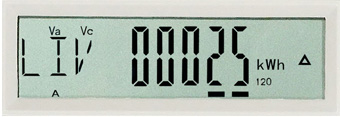
This screen displays the letters LIV for énergie livrée (energy delivered), indicating the total number of kilowatthours (kWh) measured by the meter. The meter displays kWh as a running total, much like how a car odometer displays a running total of the distance travelled. In the image, you can see the total amount of energy consumed is 25 kWh.
When the meter is first installed, it may display a value other than 0. If this is the case, the installer will note the value and it will be subtracted from your next reading so that your bill reflects your actual consumption for the period in question.
Real power
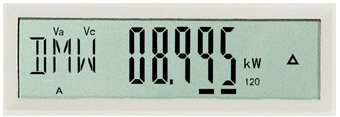
This screen displays the letters DMW for demande en watts (watt demand) and indicates the highest power demand (in kW) measured by the meter during a consumption period.
This information is not used for billing purposes.
Energy injected
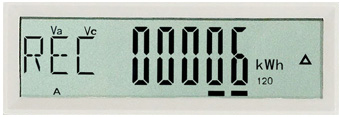
This screen, which displays the letters REC for reçu par Hydro‑Québec (received by Hydro‑Québec), indicates information for energy producers (clients enrolled in the net metering option).
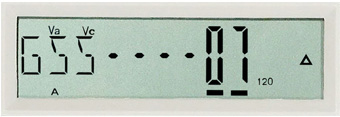
Network information
Hydro‑Québec uses this information to manage the advanced metering infrastructure system.
Power indicator
The indicator consists of two little lines that generally move from left to right at the bottom of the screen. The faster they move, the higher the consumption.
Below are the main displays and information that appear at regular intervals on the screen.
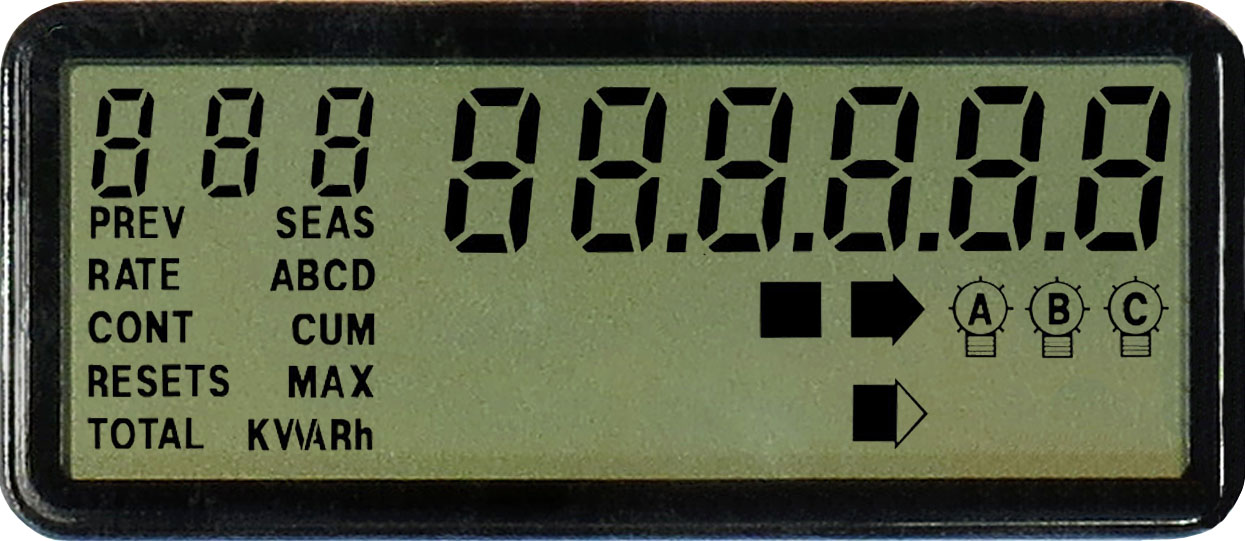
Display test
This screen shows that the liquid crystal display is working properly. When the 8s are displayed properly, the LCD is working.
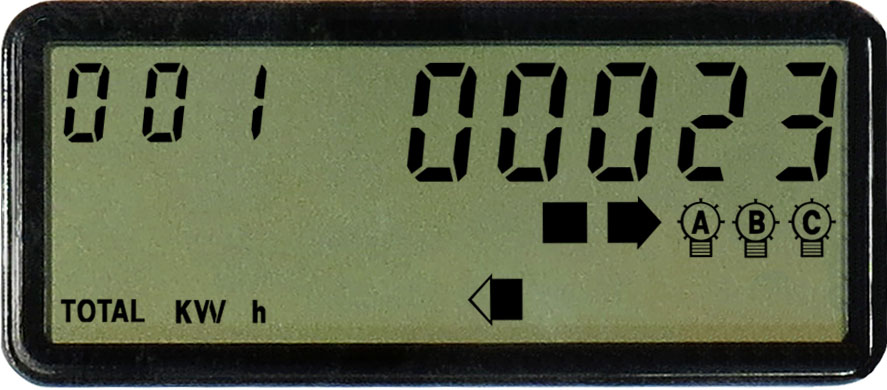
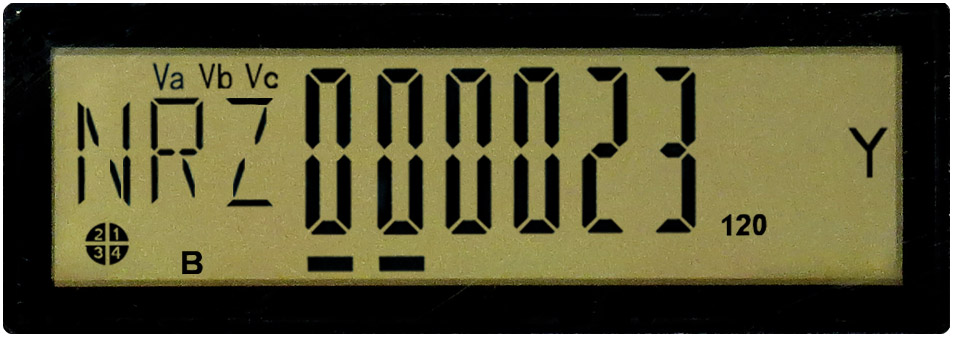
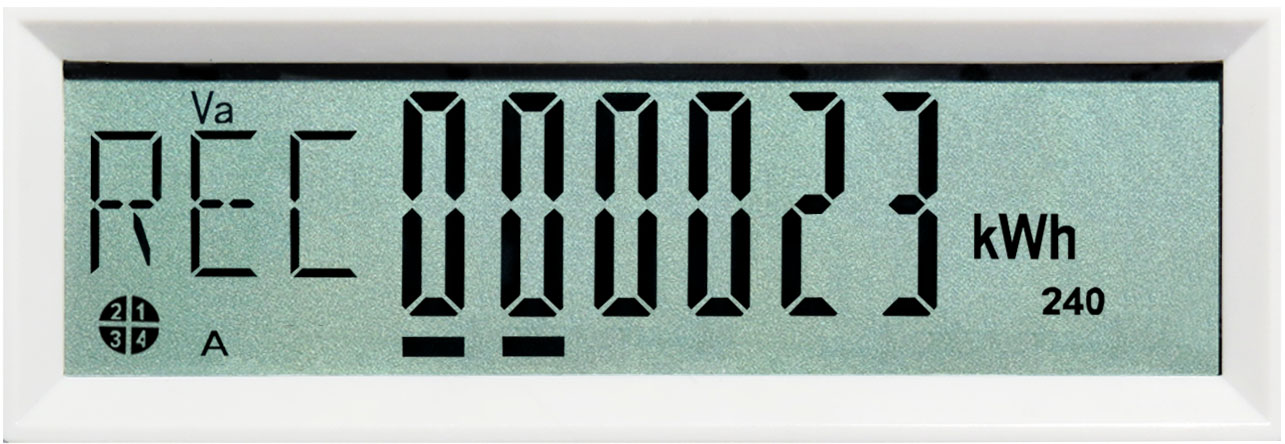
Energy consumed
This screen shows the total number of kilowatthours (kWh) measured by the meter. The meter displays kWh as a running total, much like how a car odometer displays a running total of the distance travelled. In the image, you can see the total amount of energy consumed is 23 kWh.
When the meter is first installed, it may display a value other than 0. If this is the case, the installer will note the value and it will be subtracted from your next reading so that your bill reflects your actual consumption for the period in question.
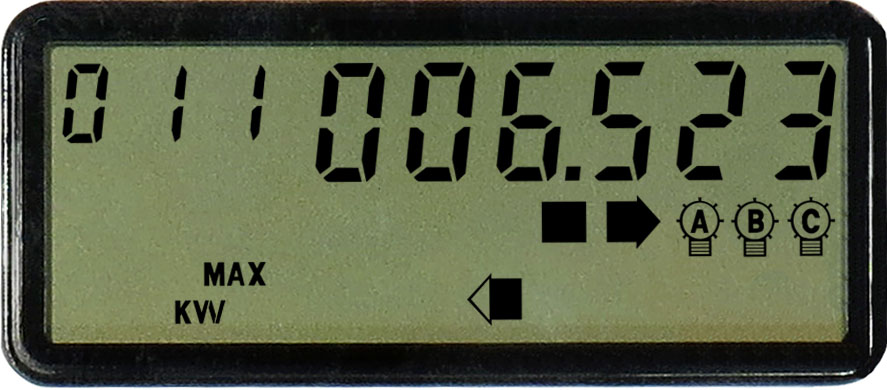
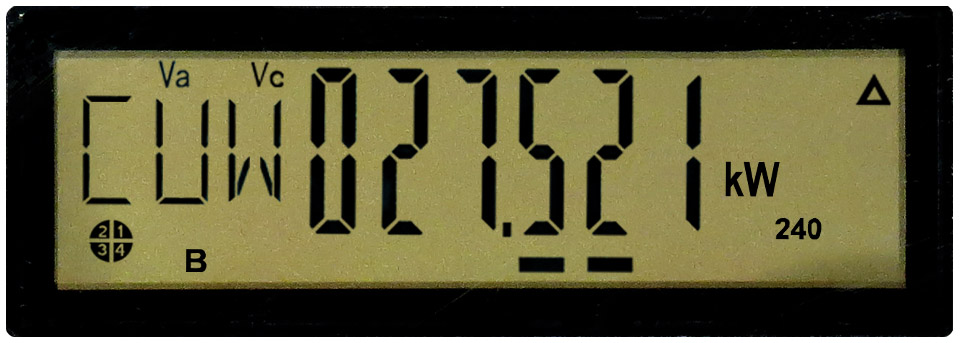
Real power
This screen indicates the highest power demand (in kW) measured by the meter during a consumption period.
When the contract is for a rate with billed power demand, this value is reset to 0 at the start of each consumption period.
This data is used only for customers whose power demand is billed.

Apparent power
This screen indicates the highest power demand (in kVA) measured by the meter during a consumption period.
When the contract is for a rate with billed power demand, this value is reset to 0 at the start of each consumption period.
This data is used only for customers whose power demand is billed.
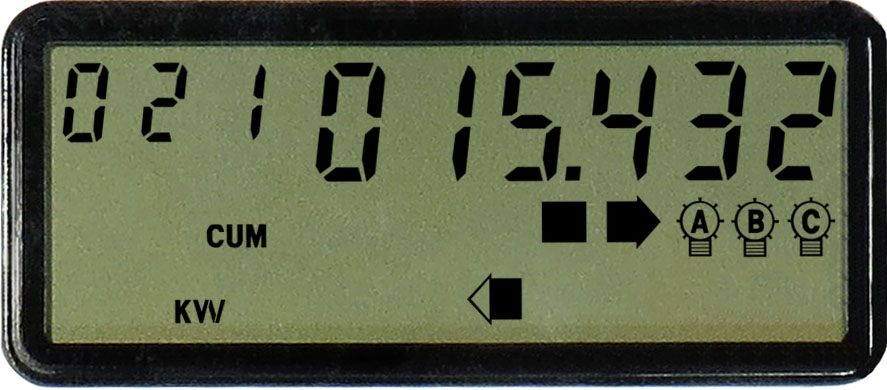
Cumulative real power
This display shows the cumulative real power for previous billing periods.
Cumulative apparent power
This display shows the cumulative apparent power for previous billing periods.
Energy injected
This screen indicates information for energy producers (clients enrolled in the net metering option).
Number of resets
This data shows the number of times Hydro‑Québec has reset the power demand indicator when taking a meter reading.
Network information
Hydro‑Québec uses this information to manage the advanced metering infrastructure system.
Power indicator
This indicator appears on every screen. The faster the little square flashes, the higher the consumption.
Below are the main displays and information that appear at regular intervals on the screen.
Display test
This screen shows that the liquid crystal display is working properly. When the 8s are displayed properly, the LCD is working.
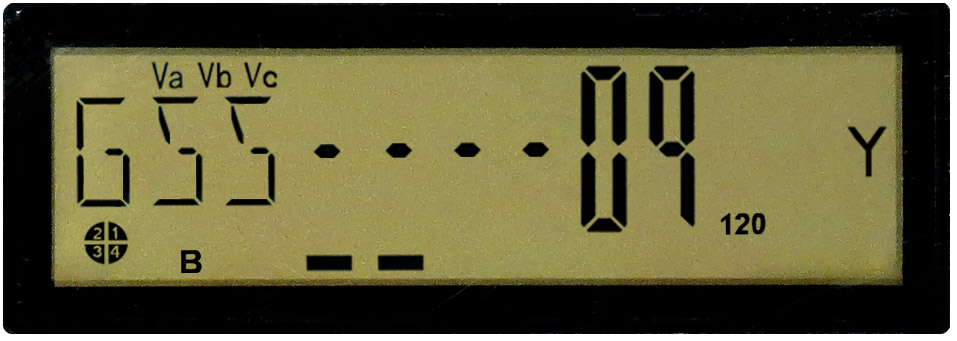
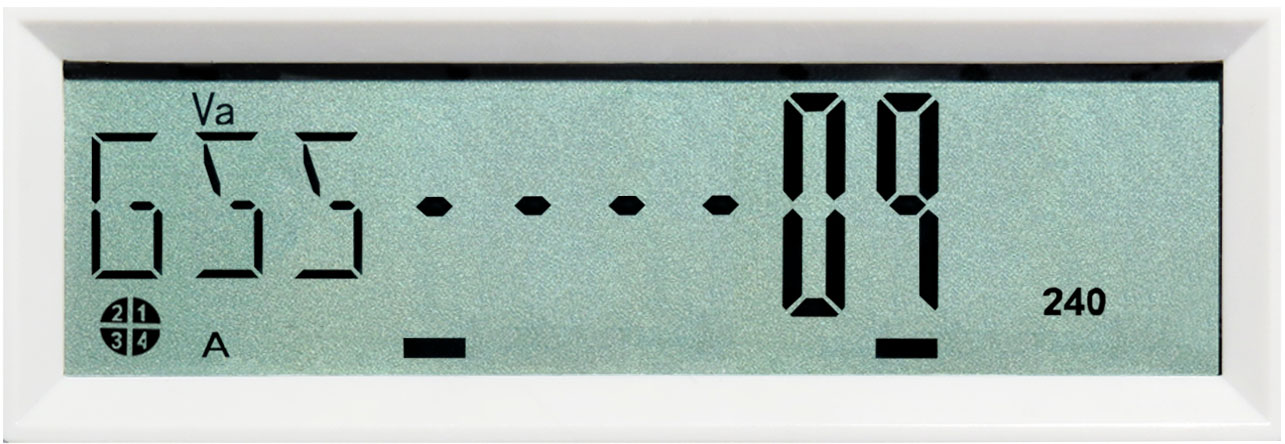
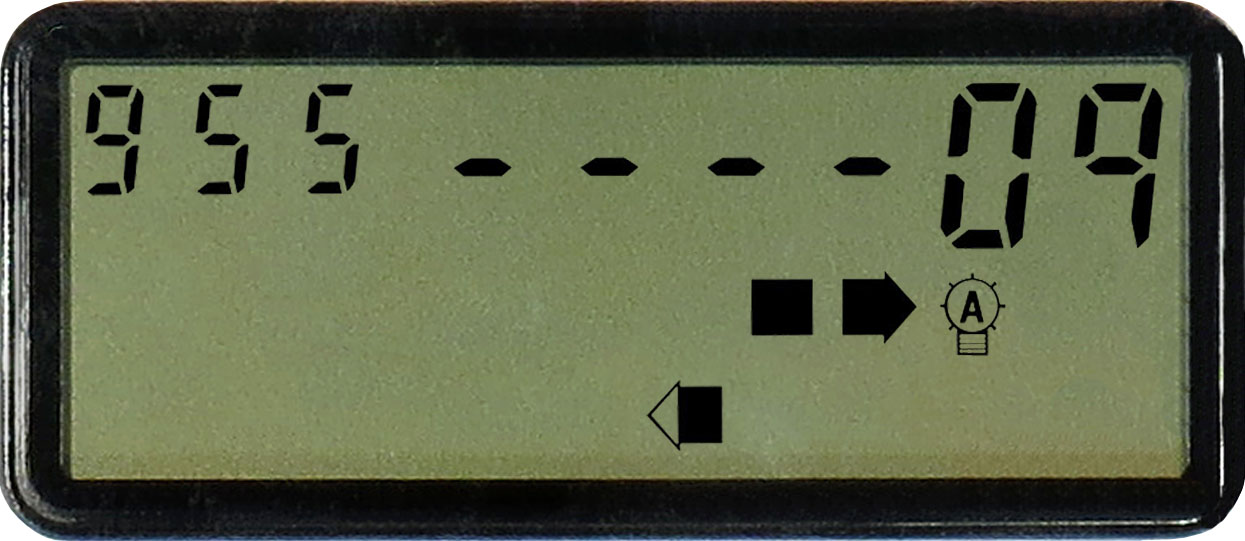
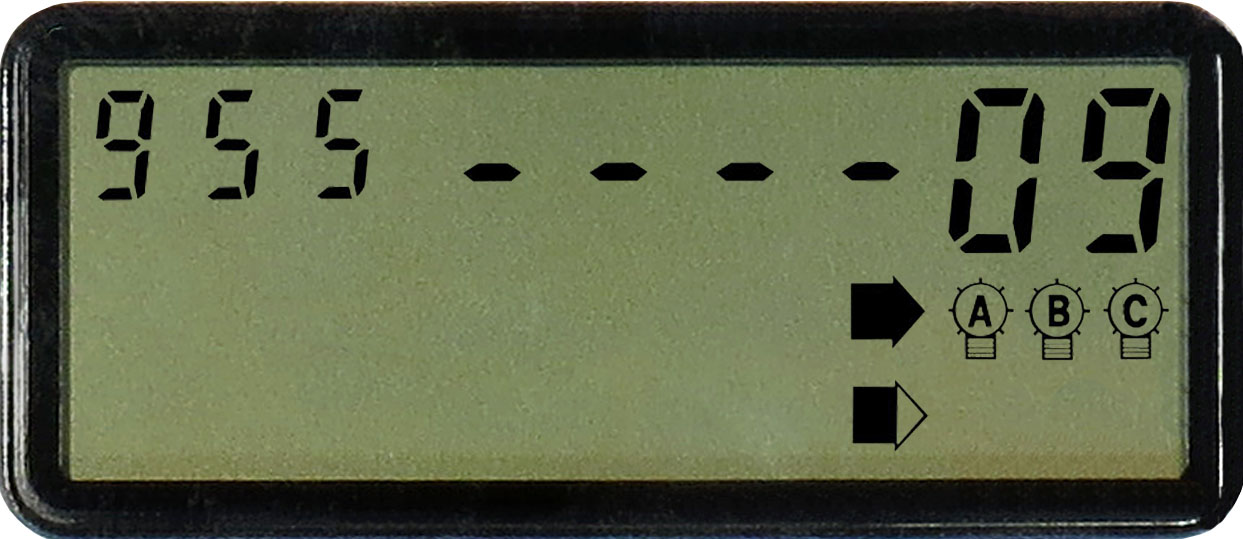
Energy consumed
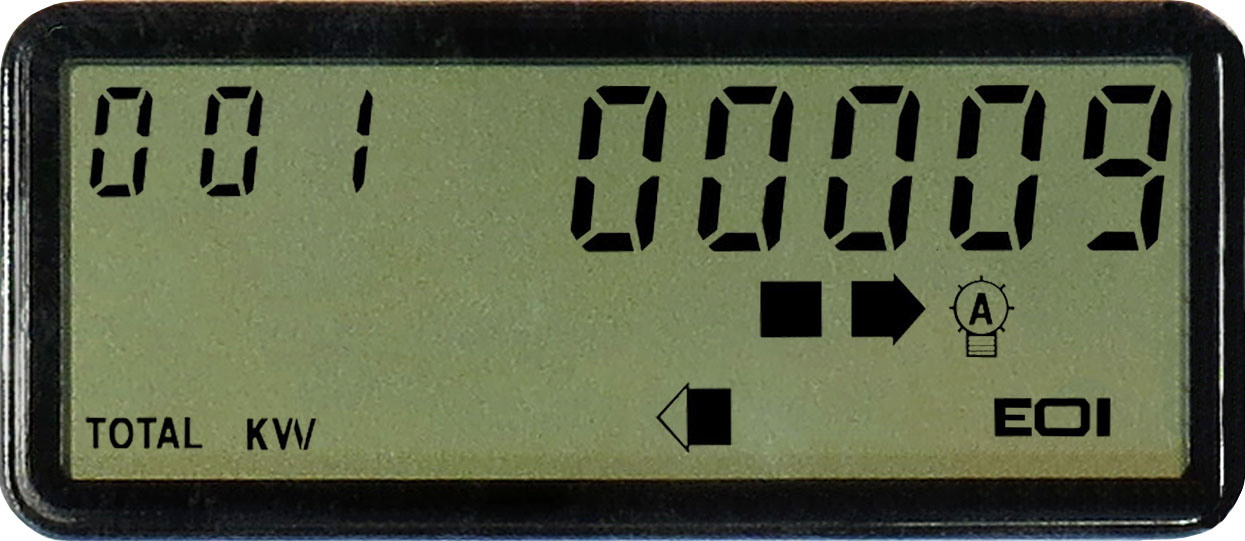
This screen shows the total number of kilowatthours (kWh) measured by the meter. The meter displays kWh as a running total, much like how a car odometer displays a running total of the distance travelled. In the image, you can see the total amount of energy consumed is 9 kWh.
When the meter is first installed, it may display a value other than 0. If this is the case, the installer will note the value and it will be subtracted from your next reading so that your bill reflects your actual consumption for the period in question.
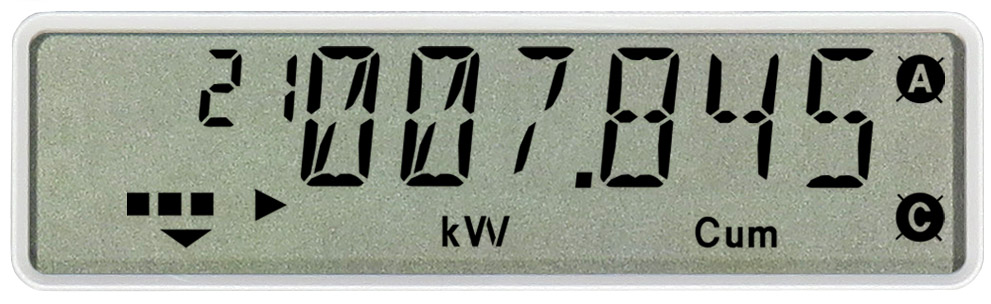
Real power
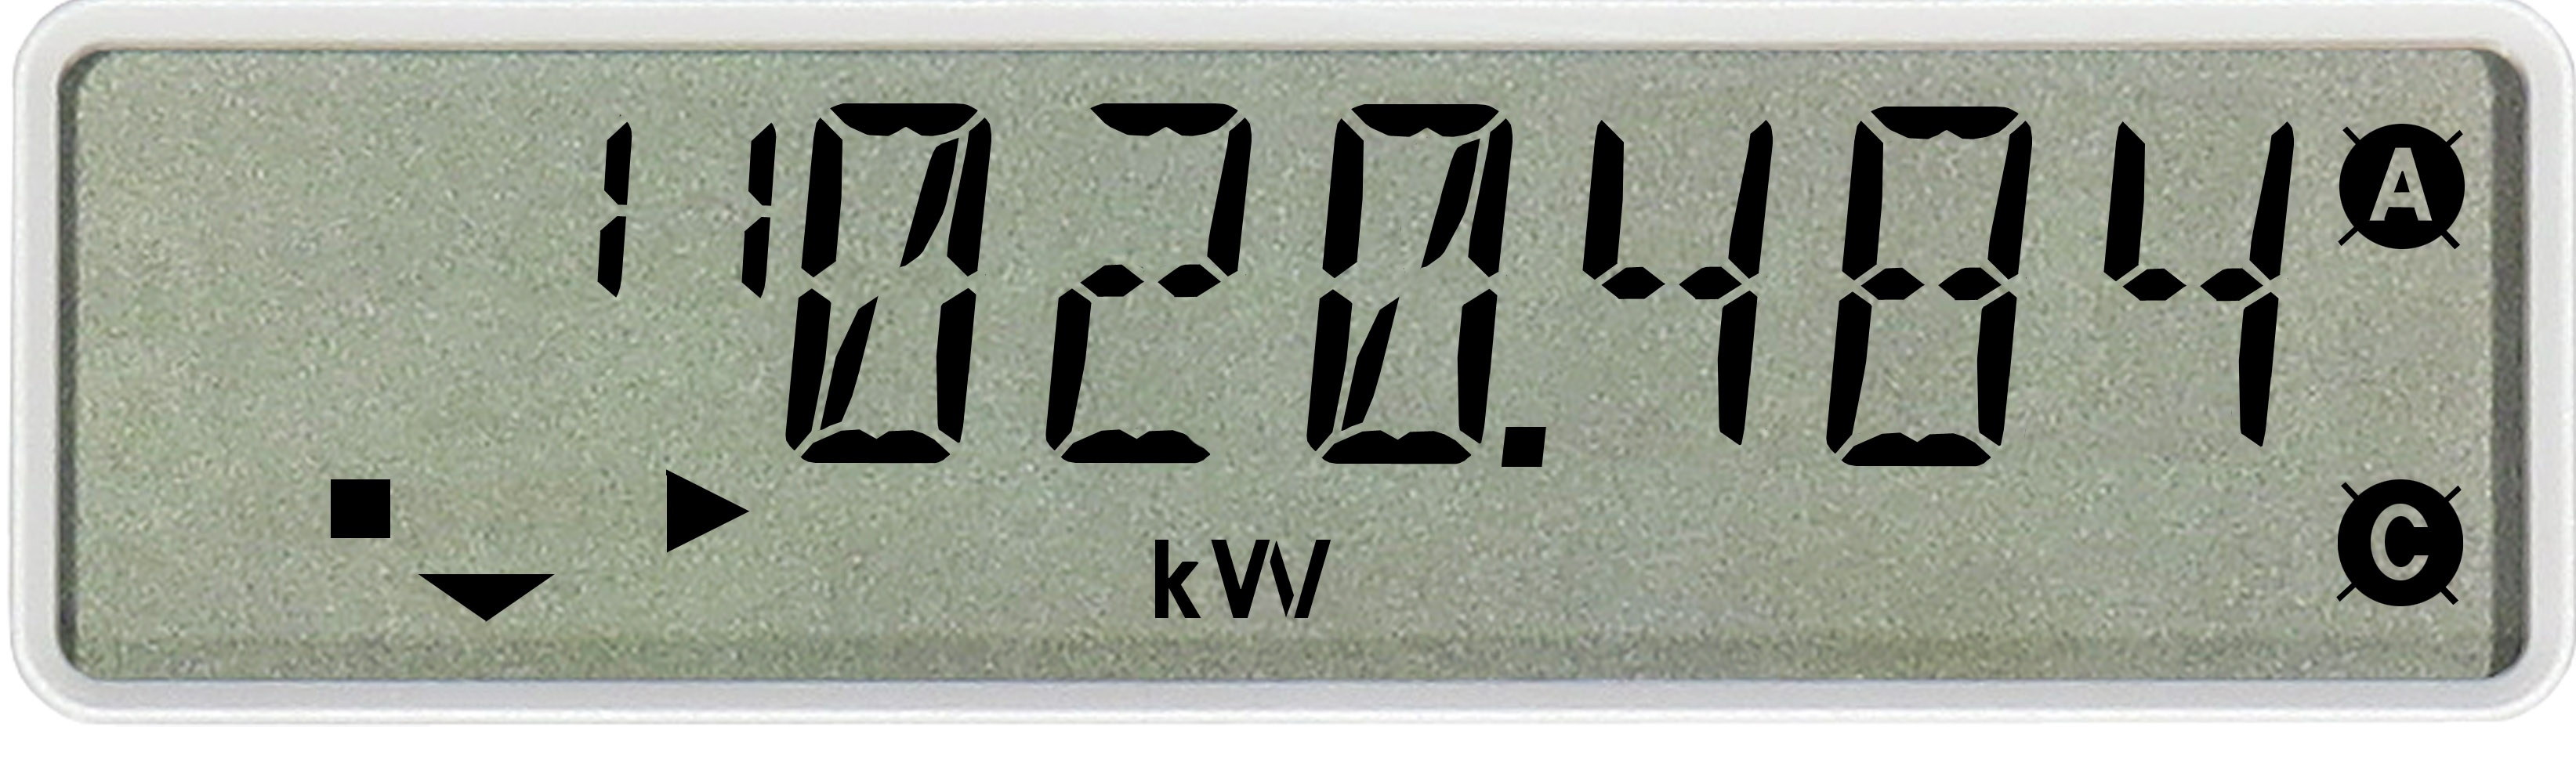
This screen indicates the highest power demand (in kW) measured by the meter during a consumption period.
When the contract is for a rate with billed power demand, this value is reset to 0 at the start of each consumption period.
This data is used only for customers whose power demand is billed.

Apparent power
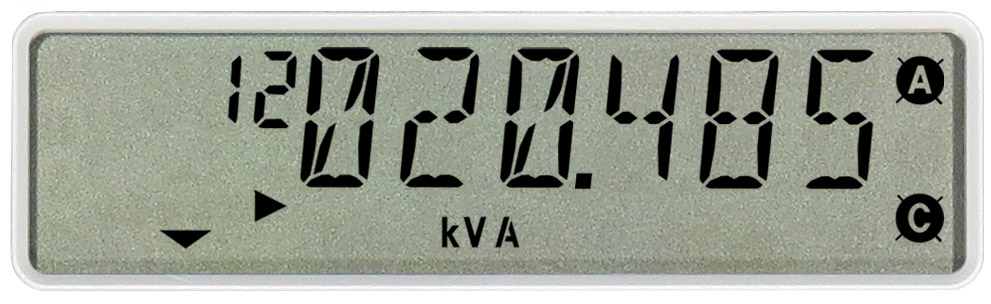
This screen indicates the highest power demand (in kVA) measured by the meter during a consumption period.
When the contract is for a rate with billed power demand, this value is reset to 0 at the start of each consumption period.
This data is used only for customers whose power demand is billed.
Cumulative real power
This display shows the cumulative real power for previous billing periods.
Cumulative apparent power
This display shows the cumulative apparent power for previous billing periods.
Energy injected
This screen indicates information for energy producers (clients enrolled in the net metering option).
Number of resets
This data shows the number of times Hydro‑Québec has reset the power demand indicator when taking a meter reading.
Network information
Hydro‑Québec uses this information to manage the advanced metering infrastructure system.
Power indicator
This indicator appears on every screen. The faster the little square flashes, the higher the consumption.
Below are the main displays and information that appear at regular intervals on the screen.
Display test
This screen shows that the liquid crystal display is working properly. When the 8s are displayed properly, the LCD is working.
Energy consumed
This screen shows the total number of kilowatthours (kWh) measured by the meter. The meter displays kWh as a running total, much like how a car odometer displays a running total of the distance travelled. In the image, you can see the total amount of energy consumed is 6 kWh.
When the meter is first installed, it may display a value other than 0. If this is the case, the installer will note the value and it will be subtracted from your next reading so that your bill reflects your actual consumption for the period in question.
Real power
This screen indicates the highest power demand (in kW) measured by the meter during a consumption period.
This information is not used for billing purposes.
Energy injected
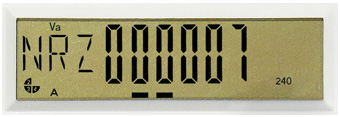
This screen indicates information for energy producers (clients enrolled in the net metering option). It is characterized by the minus (-) sign.
Network information
Hydro‑Québec uses this information to manage the advanced metering infrastructure system.
Power indicator
This indicator appears on every screen. The faster the little square flashes, the higher the consumption.
Below are the main displays and information that appear at regular intervals on the screen.
Display test
This screen shows that the liquid crystal display is working properly. When the 8s are displayed properly, the LCD is working.
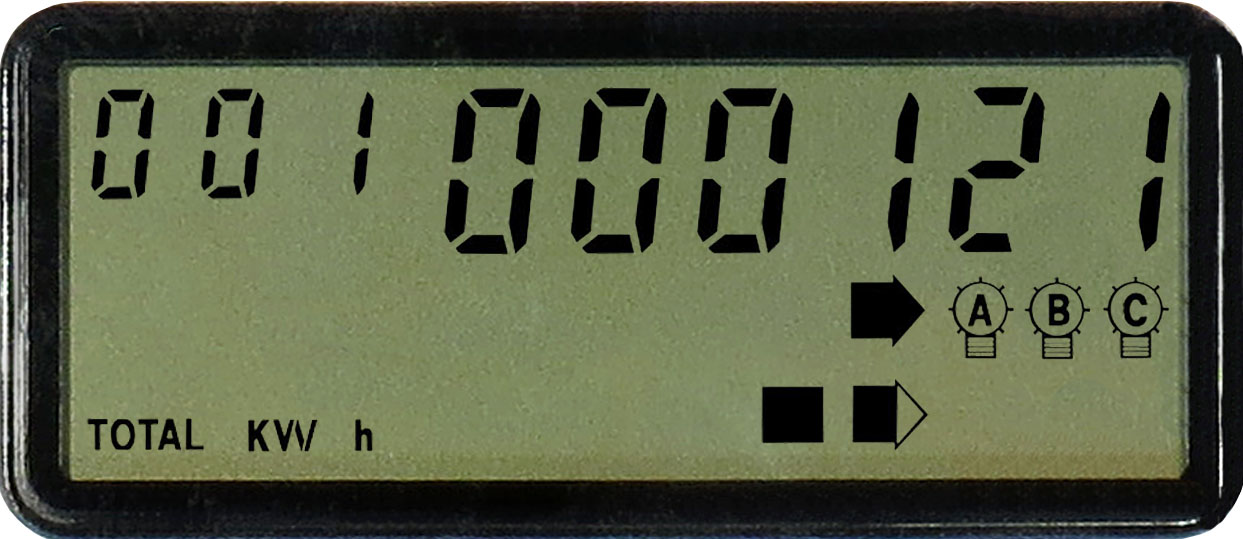
Energy consumed
This screen shows the total number of kilowatthours (kWh) measured by the meter. The meter displays kWh as a running total, much like how a car odometer displays a running total of the distance travelled. In the image, you can see the total amount of energy consumed is 121 kWh.
When the meter is first installed, it may display a value other than 0. If this is the case, the installer will note the value and it will be subtracted from your next reading so that your bill reflects your actual consumption for the period in question.
Real power
This screen indicates the highest power demand (in kW) measured by the meter during a consumption period.
When the contract is for a rate with billed power demand, this value is reset to 0 at the start of each consumption period.
This data is used only for customers whose power demand is billed.
Apparent power
This screen indicates the highest power demand (in kVA) measured by the meter during a consumption period.
When the contract is for a rate with billed power demand, this value is reset to 0 at the start of each consumption period.
This data is used only for customers whose power demand is billed.
Cumulative real power
This display shows the cumulative real power for previous billing periods.
Cumulative apparent power
This display shows the cumulative apparent power for previous billing periods.
Energy injected
This screen indicates information for energy producers (clients enrolled in the net metering option).
Number of resets
This data shows the number of times Hydro‑Québec has reset the power demand indicator when taking a meter reading.
Network information
Hydro‑Québec uses this information to manage the advanced metering infrastructure system.
Power indicator
This indicator appears on every screen. The faster the little square flashes, the higher the consumption.
Below are the main displays and information that appear at regular intervals on the screen.
Display test
This screen shows that the liquid crystal display is working properly.
Energy consumed
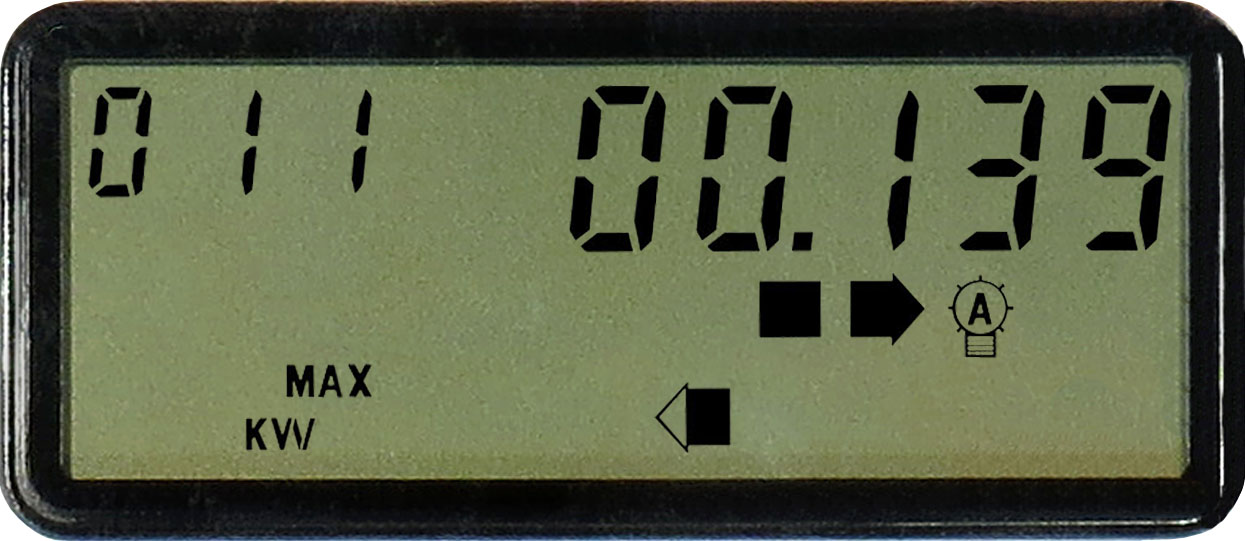
This screen shows the total number of kilowatthours (kWh) measured by the meter. The meter displays kWh as a running total, much like how a car odometer displays a running total of the distance travelled. In the image, you can see the total amount of energy consumed is 11 kWh.
When the meter is first installed, it may display a value other than 0. If this is the case, the installer will note the value and it will be subtracted from your next reading so that your bill reflects your actual consumption for the period in question.
Real power
This screen indicates the highest power demand (in kW) measured by the meter during a consumption period.
When the contract is for a rate with billed power demand, this value is reset to 0 at the start of each consumption period.
This data is used only for customers whose power demand is billed.
Apparent power
This screen indicates the highest power demand (in kVA) measured by the meter during a consumption period.
When the contract is for a rate with billed power demand, this value is reset to 0 at the start of each consumption period.
This data is used only for customers whose power demand is billed.
Cumulative real power
This display shows the cumulative real power for previous billing periods.
Cumulative apparent power
This display shows the cumulative apparent power for previous billing periods.
Energy injected
This screen indicates information for energy producers (clients enrolled in the net metering option).
Number of resets
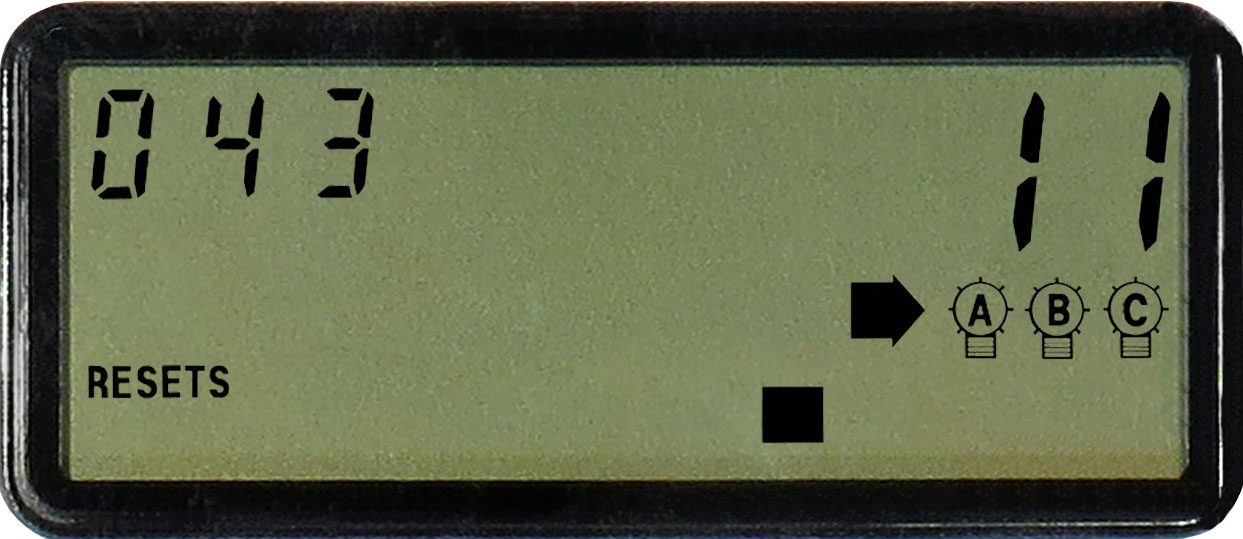
This data shows the number of times Hydro‑Québec has reset the power demand indicator when taking a meter reading.
Power indicator
This indicator appears on every screen. The faster the little square moves, the higher the consumption.
Non-communicating meters
Below are the main displays and information that appear at regular intervals on the screen.

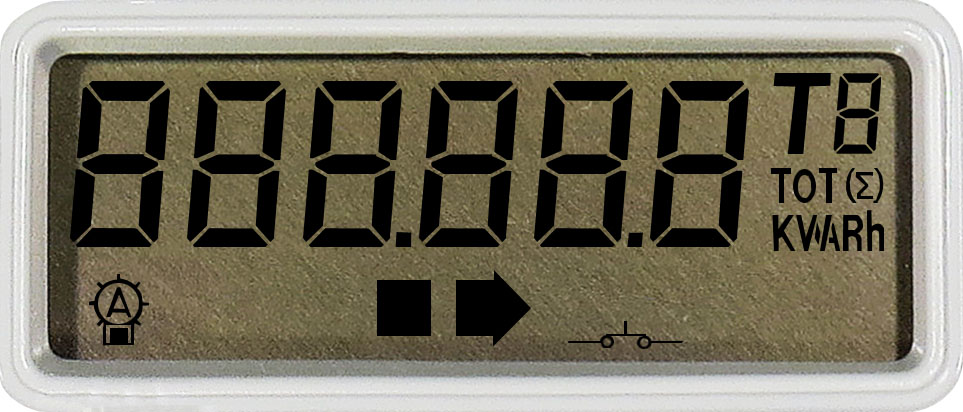
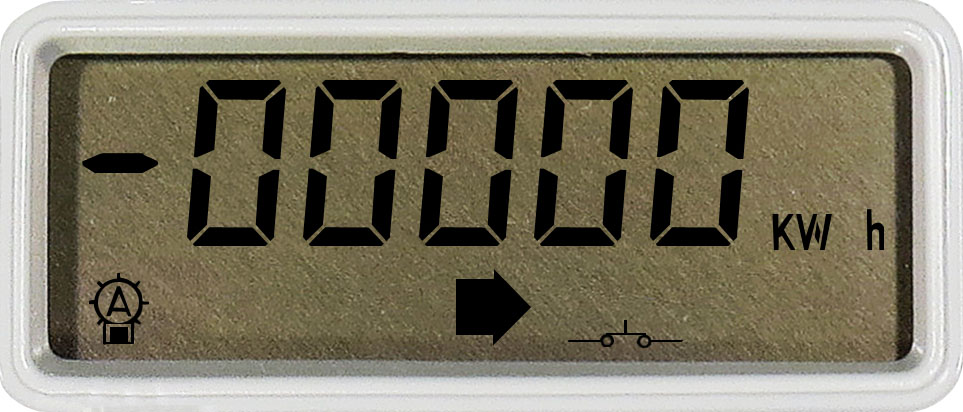
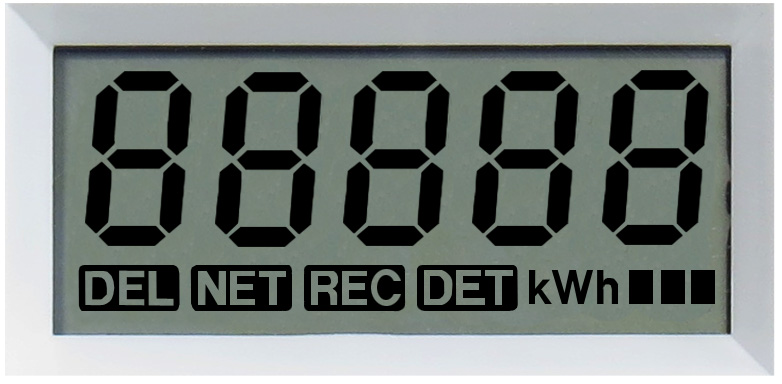
Display test
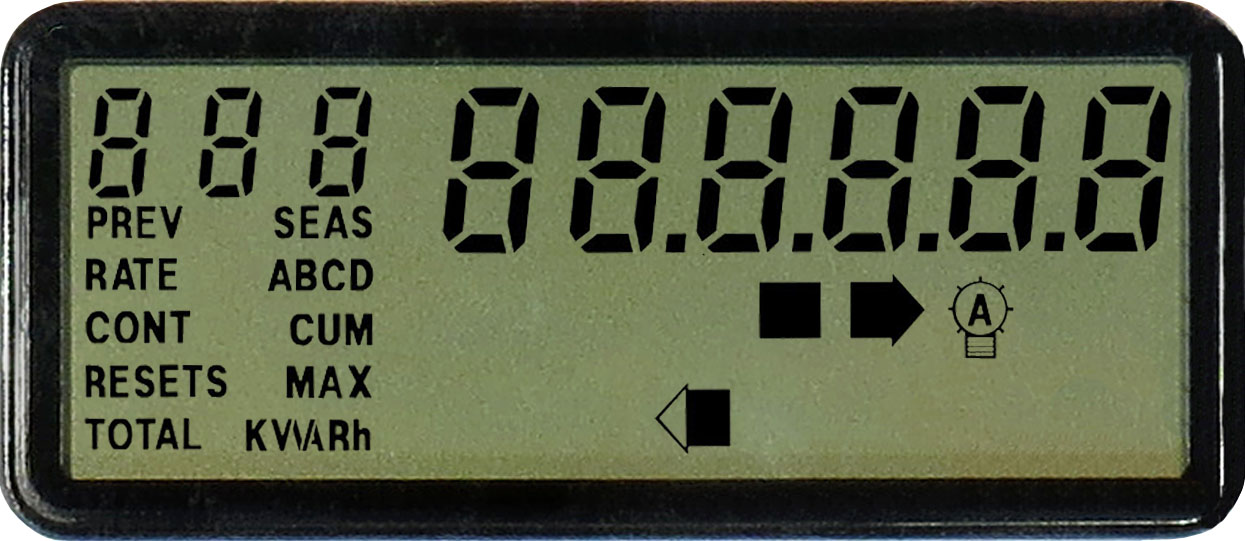
This screen shows that the liquid crystal display is working properly. When the 8s are displayed properly, the LCD is working.

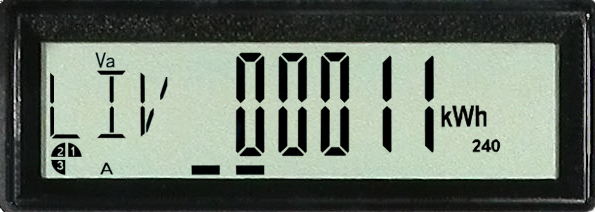
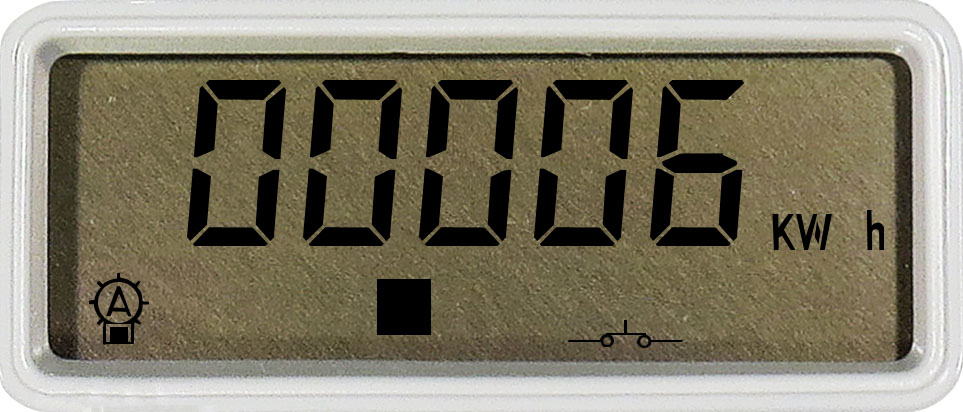
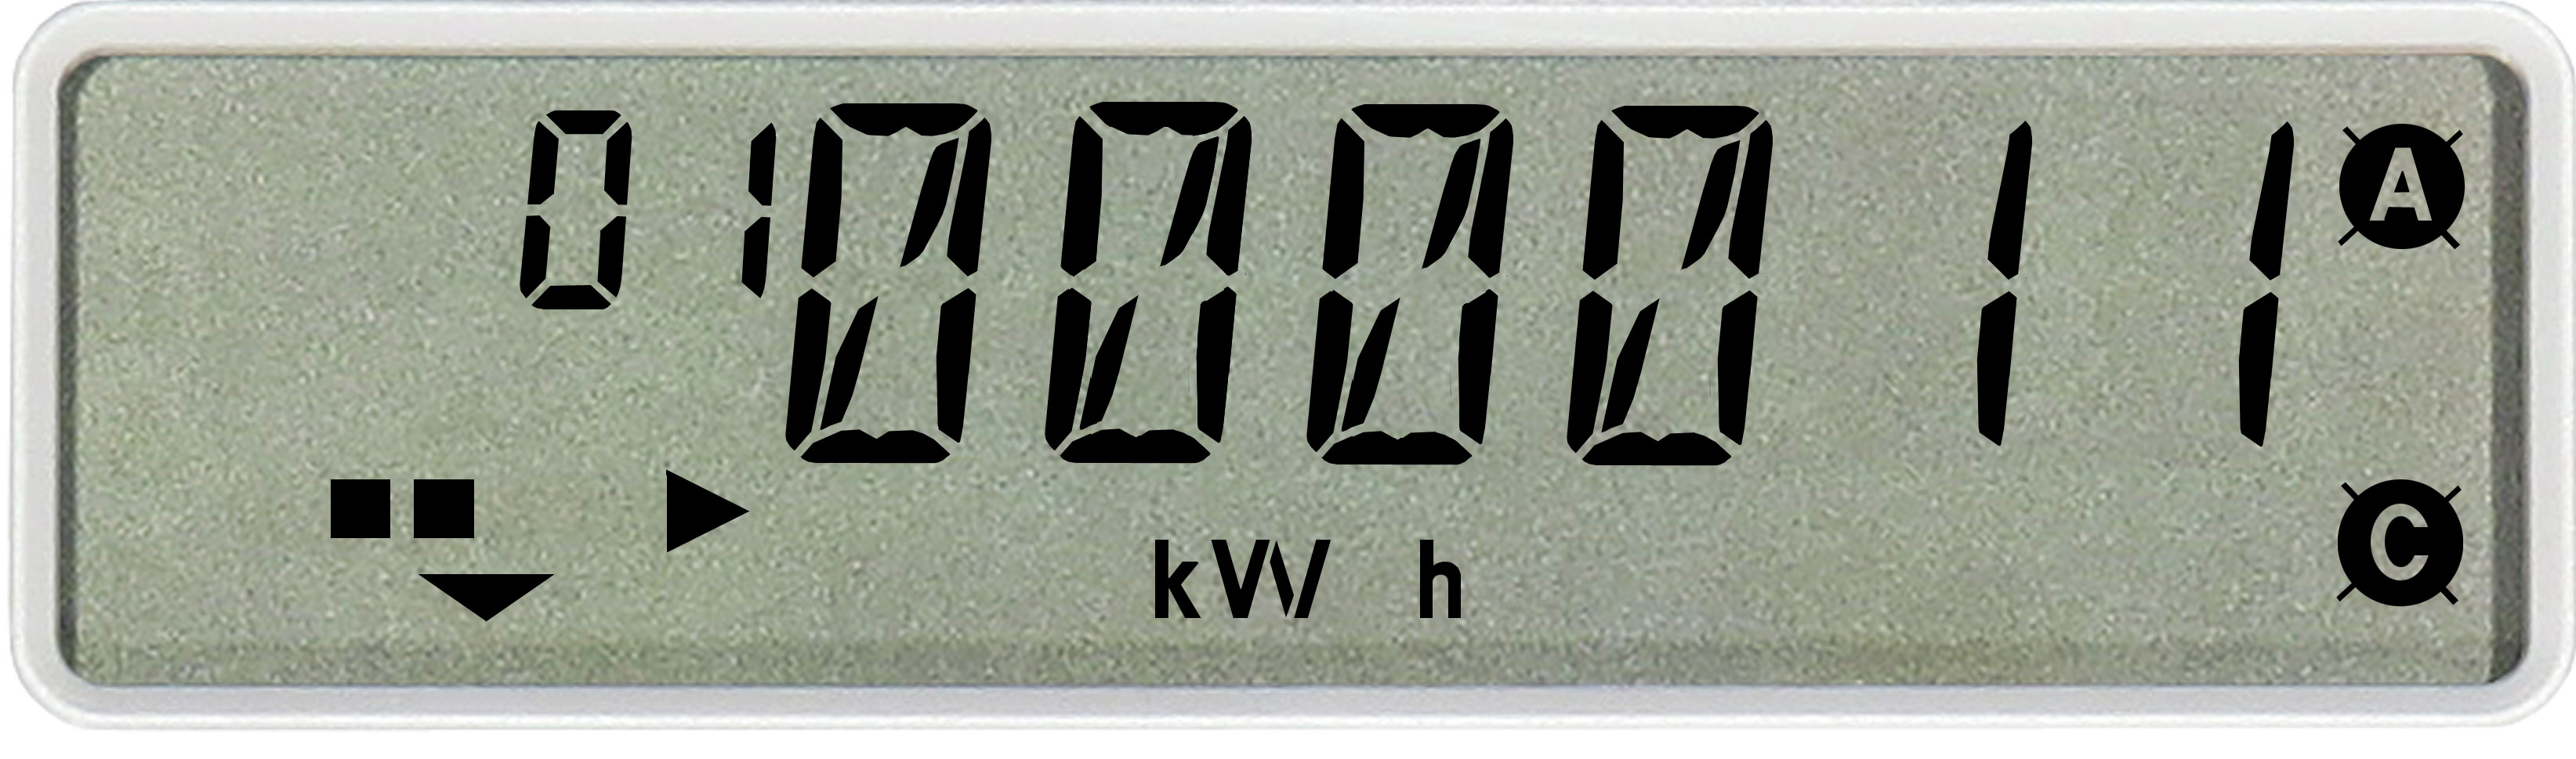
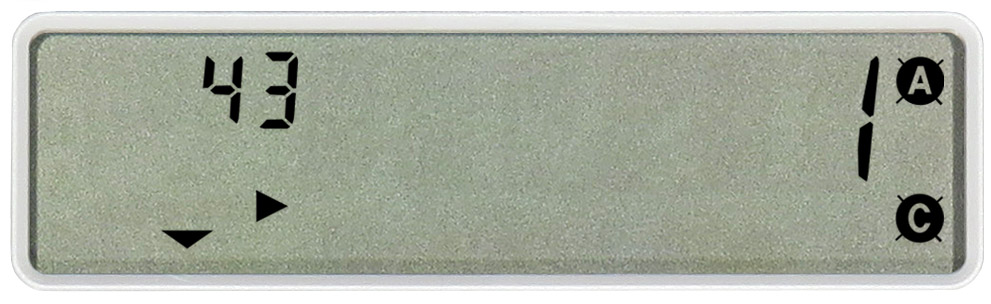
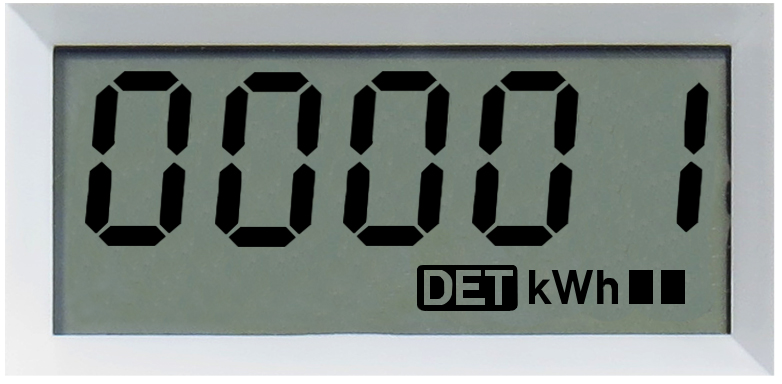
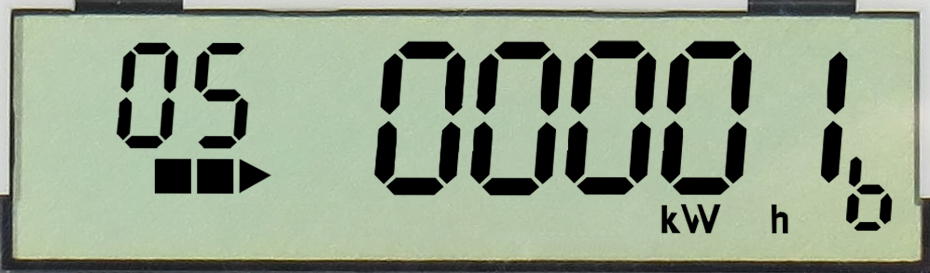
Energy consumed
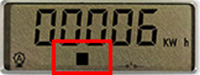
This screen shows the total number of kilowatthours (kWh) measured by the meter. The meter displays kWh as a running total, much like how a car odometer displays a running total of the distance travelled. In the image, you can see the total amount of energy consumed is 1 kWh.
When the meter is first installed, it may display a value other than 0. If this is the case, the installer will note the value and it will be subtracted from your next reading so that your bill reflects your actual consumption for the period in question.

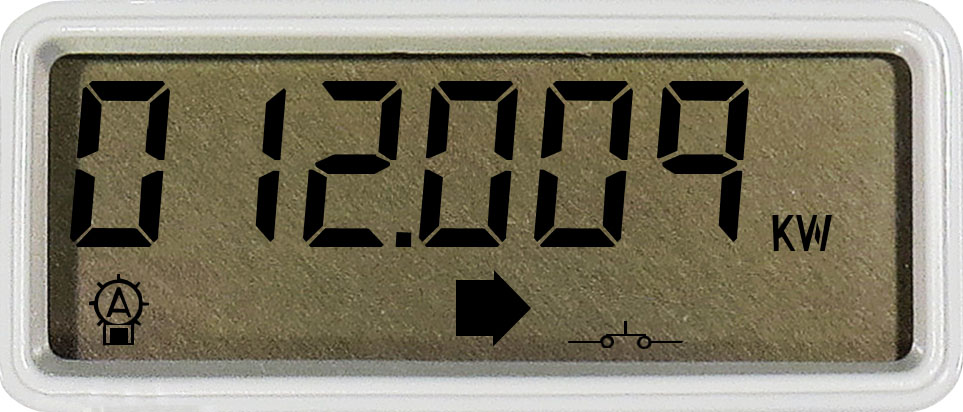
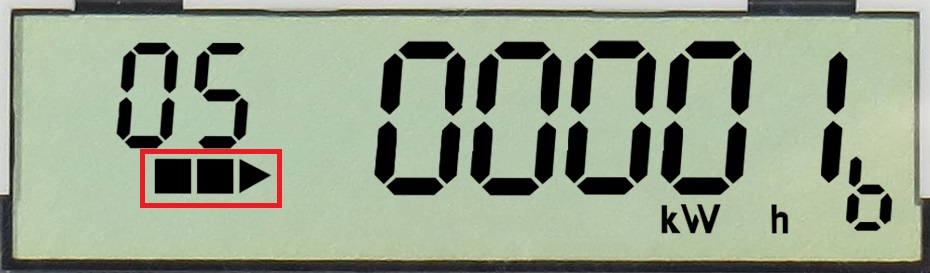
Power indicator
This indicator appears on every screen. The faster the little squares move, the higher the consumption.
Below are the main displays and information that appear at regular intervals on the screen.
Display test
This screen shows that the liquid crystal display is working properly. When the 8s are displayed properly, the LCD is working.
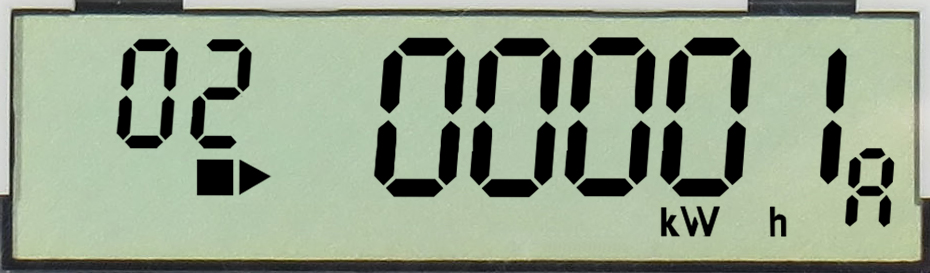
Energy consumed
This screen shows the total number of kilowatthours (kWh) measured by the meter. The meter displays kWh as a running total, much like how a car odometer displays a running total of the distance travelled. In the image, you can see the total amount of energy consumed is 1 kWh.
When the meter is first installed, it may display a value other than 0. If this is the case, the installer will note the value and it will be subtracted from your next reading so that your bill reflects your actual consumption for the period in question.

Power indicator
This indicator appears on every screen. The faster the little squares move, the higher the consumption.
Below are the main displays and information that appear at regular intervals on the screen.
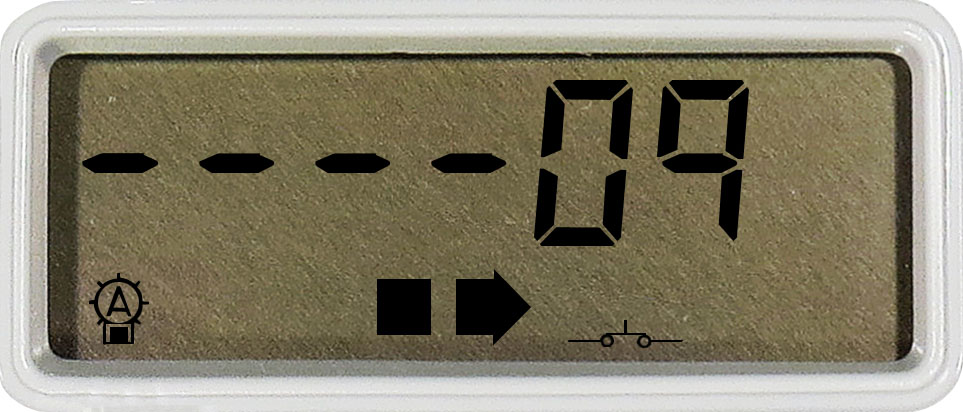
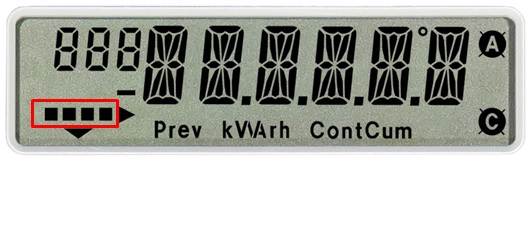
Display test
This screen shows that the liquid crystal display is working properly. When the 8s are displayed properly, the LCD is working.
Energy consumed – higher price
This screen indicates the total number of kilowatthours (kWh) billed at the higher of the two Rate DT prices. The meter displays kWh as a running total, much like how a car odometer displays a running total of the distance travelled. In the image, you can see the total amount of energy consumed is 1 kWh.
When the meter is first installed, it may display a value other than 0. If this is the case, the installer will note the value and it will be subtracted from your next reading so that your bill reflects your actual consumption for the period in question.
Energy consumed – lower price
This screen indicates the total number of kilowatthours (kWh) billed at the lower of the two Rate DT prices. The meter displays kWh as a running total, much like how a car odometer displays a running total of the distance travelled. In the image, you can see the total amount of energy consumed is 1 kWh.
When the meter is first installed, it may display a value other than 0. If this is the case, the installer will note the value and it will be subtracted from your next reading so that your bill reflects your actual consumption for the period in question.
Power indicator
This indicator appears on every screen. The faster the little squares move, the higher the consumption.
Below are the main displays and information that appear at regular intervals on the screen.

Display test
This screen shows that the liquid crystal display is working properly. When the 8s are displayed properly, the LCD is working.
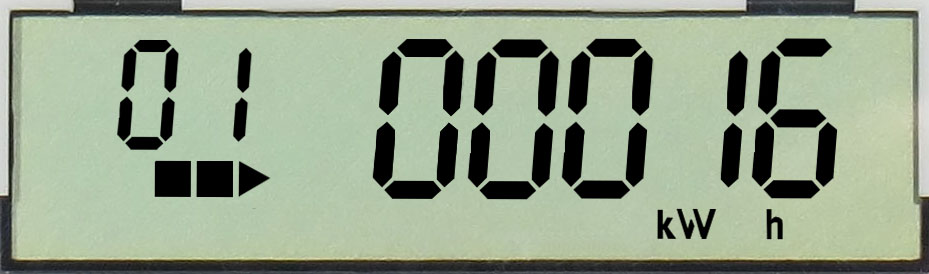
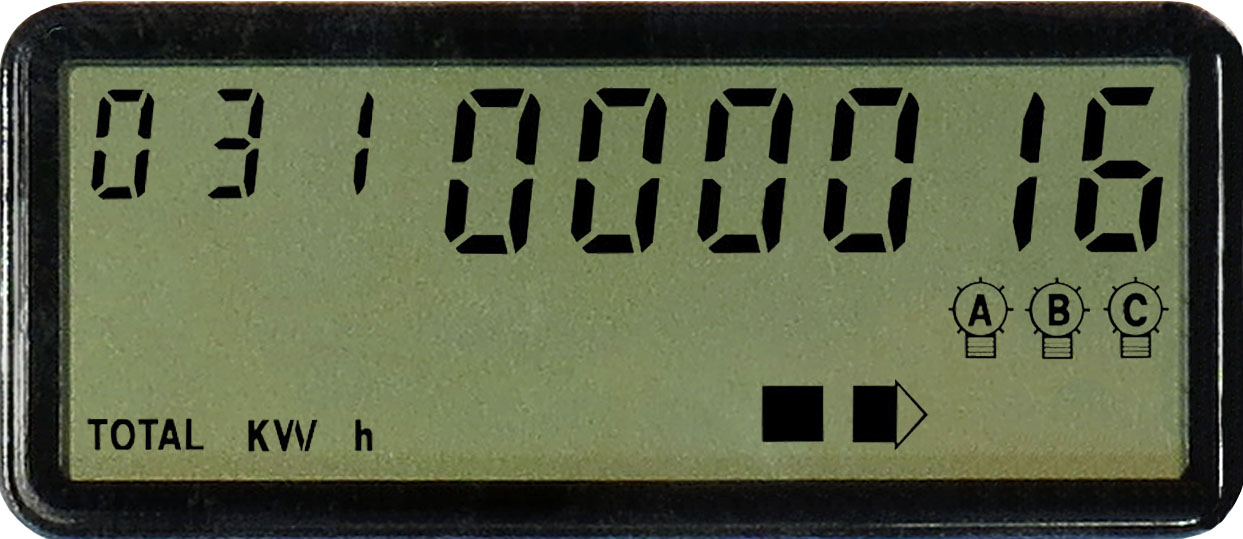
Energy consumed
This screen shows the total number of kilowatthours (kWh) measured by the meter. The meter displays kWh as a running total, much like how a car odometer displays a running total of the distance travelled. In the image, you can see the total amount of energy consumed is 16 kWh.
When the meter is first installed, it may display a value other than 0. If this is the case, the installer will note the value and it will be subtracted from your next reading so that your bill reflects your actual consumption for the period in question.
Energy injected
This screen indicates information for energy producers (clients enrolled in the net metering option).
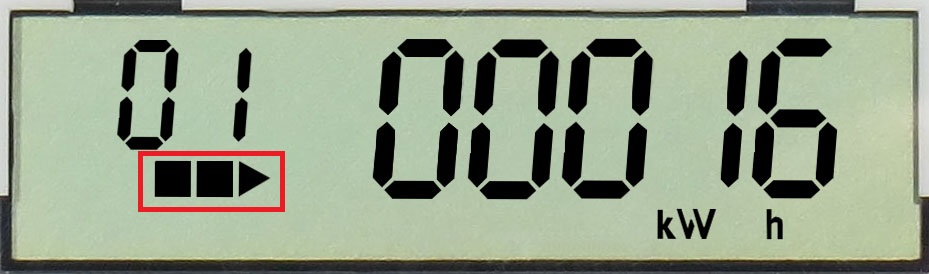
Power indicator
This indicator appears on every screen. The faster the little squares move, the higher the consumption.
Below are the main displays and information that appear at regular intervals on the screen.

Display test
This screen shows that the liquid crystal display is working properly. When the 8s are displayed properly, the LCD is working.

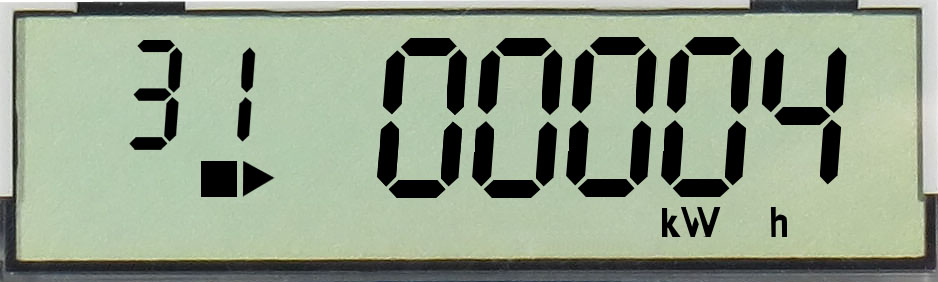
Energy consumed
This screen shows the total number of kilowatthours (kWh) measured by the meter. The meter displays kWh as a running total, much like how a car odometer displays a running total of the distance travelled. In the image, you can see the total amount of energy consumed is 1 kWh.
When the meter is first installed, it may display a value other than 0. If this is the case, the installer will note the value and it will be subtracted from your next reading so that your bill reflects your actual consumption for the period in question.
Power indicator
This indicator appears on every screen. The faster the little squares move, the higher the consumption.
Older technology – These meters are no longer available
Electronic meter
This meter also measures energy consumption (kWh).

Electronic dual-register meter
If your contract is at Rate DT (dual energy), you have an electromechanical or electronic dual-register meter like this one. It indicates kilowatthours first at the higher rate, then the lower rate.

Electromechanical meter
This meter, characterized by its spinning disc and multiple dials, measures energy consumption (kWh) and power demand (in kW).

Power meter
Used primarily by business customers, this meter measures energy consumption (kWh) and power demand (in kW) during a given consumption period.
